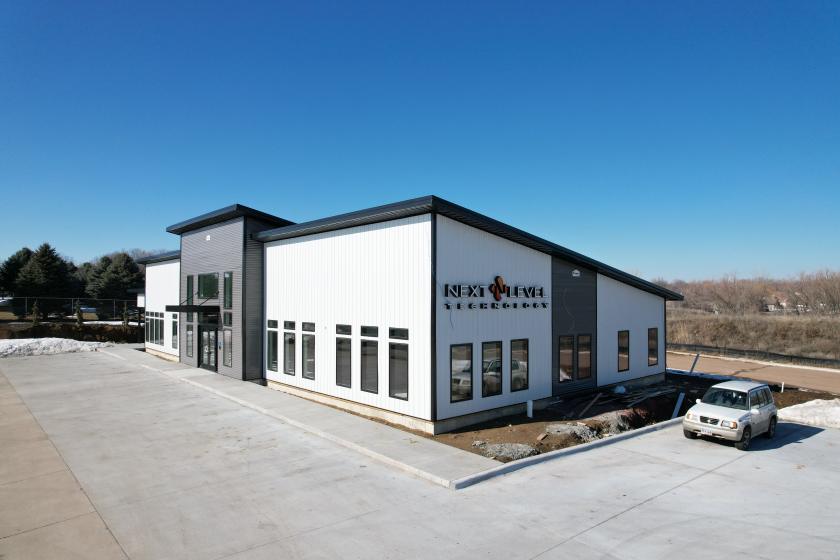
1-Mile | 3-Miles | 5-Miles | ||
---|---|---|---|---|
Total Population | 11,219 | 56,363 | 116,231 | |
Population Median Age | 35 | 37 | 38 | |
Population by Age | 0-9 Yrs | 1909 (17%) | 8236 (14%) | 15266 (13%) |
10-19 Yrs | 1455 (12%) | 7719 (13%) | 15105 (12%) | |
20-29 Yrs | 1573 (14%) | 7852 (13%) | 17241 (14%) | |
30-39 Yrs | 1711 (15%) | 7823 (13%) | 17309 (14%) | |
40-49 Yrs | 1297 (11%) | 6915 (12%) | 13663 (11%) | |
50-59 Yrs | 1461 (13%) | 7017 (12%) | 13777 (11%) | |
60-69 Yrs | 942 (8%) | 6076 (10%) | 12856 (11%) | |
70+ Yrs | 870 (7%) | 4724 (8%) | 11014 (9%) | |
Median HH Income | $57,752 | $70,880 | $71,288 | |
Total Household Income | < 24K | 561 (13%) | 2912 (12%) | 6096 (12%) |
25-49K | 1210 (28%) | 5131 (22%) | 10501 (21%) | |
50-74K | 739 (17%) | 3881 (17%) | 8424 (17%) | |
75-99K | 766 (17%) | 3694 (16%) | 7239 (15%) | |
100-199K | 866 (20%) | 5447 (23%) | 11869 (24%) | |
200K+ | 167 (3%) | 1733 (7%) | 3755 (7%) | |
Highest Education Level | No Diploma | 1158 | 3299 | 5416 |
Diploma or GED | 2287 | 9826 | 19753 | |
Some College | 1379 | 7047 | 15354 | |
Assoc. Degree | 869 | 3824 | 8066 | |
Bachelors Degree | 1040 | 8399 | 18917 | |
Higher Degree | 363 | 3842 | 9528 | |
Total Housing Units | 4,667 | 24,305 | 51,465 | |
--Owner-Occupied | 2,178 | 14,555 | 29,385 | |
--Renter-Occupied | 2,130 | 8,244 | 18,497 | |
Owner-Occupied Values | < 100K | 177 | 1127 | 2187 |
100-199K | 489 | 4019 | 7629 | |
200-299K | 764 | 4176 | 8731 | |
300-399K | 604 | 2773 | 5416 | |
400-499K | 54 | 1216 | 2572 | |
500K+ | 89 | 1245 | 2850 | |
Total Working Age Population | 8,339 | 43,178 | 91,854 | |
In Work Force | 6,293 | 32,305 | 66,934 | |
Not In Work Force | 2,047 | 10,874 | 24,920 | |
Workforce Employed | 6,081 | 31,357 | 65,174 | |
Workforce Unemployed | 211 | 866 | 1,597 | |
Civlian Workforce | 6,293 | 32,224 | 66,771 | |
Military Workforce | 0 | 81 | 162 | |
Total Households | 4,308 | 22,799 | 47,883 | |
Family Households | 2,845 | 14,107 | 27,976 | |
Non-Family Households | 1,463 | 8,692 | 19,907 | |
Married Couple | 1,951 | 10,694 | 21,247 | |
Other Family | 894 | 3,413 | 6,728 | |
Married w/Child | 1,014 | 4,695 | 8,775 | |
Single Male w/Child | 224 | 721 | 1,218 | |
Single Female w/Child | 385 | 1,611 | 3,142 |
Population Change Last Two Decades - Plus Projection
2000 | % | 2010 | % | 2020 | % | 2030 | |
---|---|---|---|---|---|---|---|
Iowa | 2,926,324 | +4 | 3,046,355 | +5 | 3,190,369 | -100 | |
Lyon County | 11,763 | -2 | 11,581 | +3 | 11,934 | -100 | |
South Dakota | 754,844 | +8 | 814,180 | +9 | 886,667 | +7 | 951,885 |
Minnehaha County | 148,281 | +14 | 169,468 | +16 | 197,214 | +4 | 205,960 |
Lincoln County | 24,131 | +86 | 44,828 | +45 | 65,161 | +21 | 78,966 |
Total Working Age Population:
Total Households:
Total Working Age Population:
Total Households:
Total Working Age Population:
Total Households: