Commercial Land
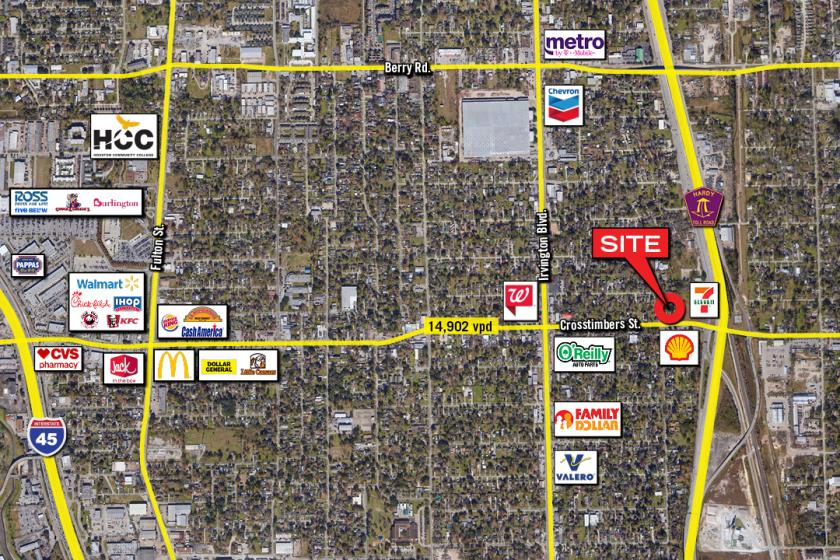
0 Crosstimbers St. Houston, TX 77022
0 Crosstimbers St. Houston, TX 77022
Details & Description
Property Highlights
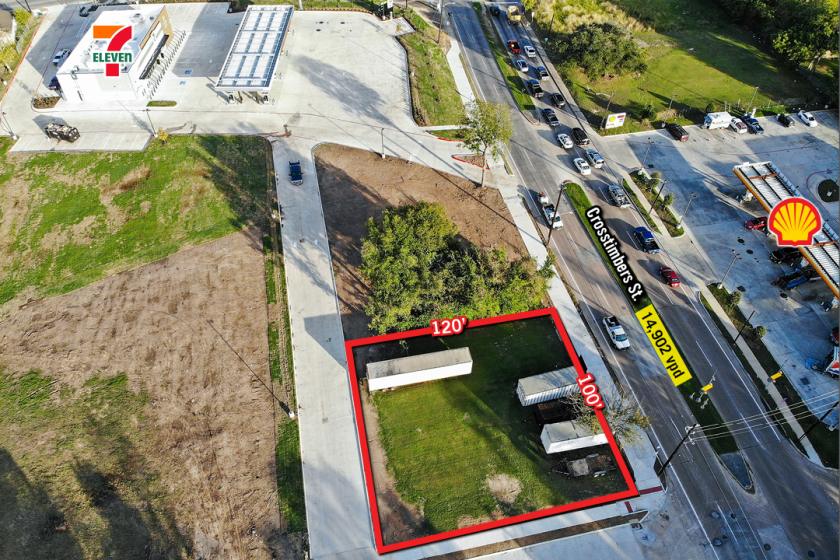
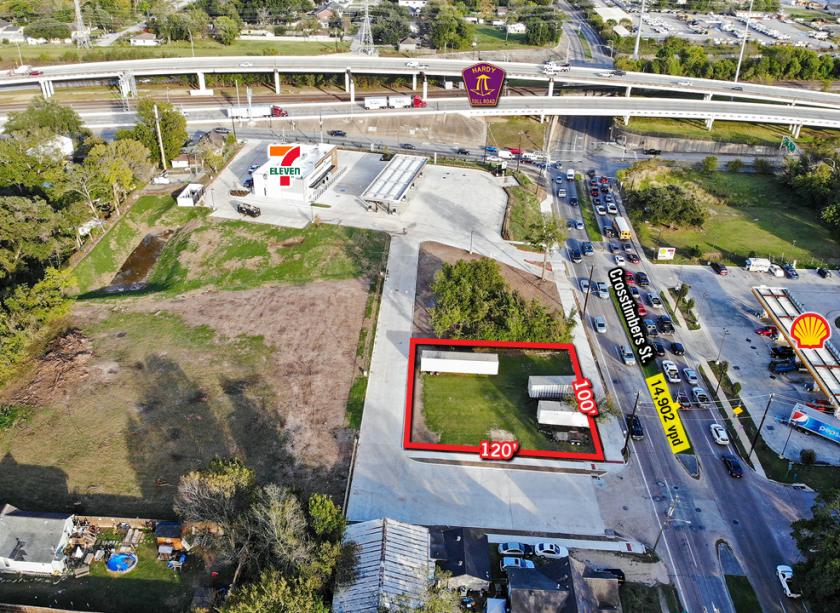
- • Adjacent to 7-Eleven
- • Utilities Available
- • No Restrictions
- • Immediate Access to Hardy Toll Rd
- • Crosstimbers St./Hardy Toll Rd.
Listing Agents

Ashley Casterlin
O: 832-581-3629
ashley@davis-commercial.com
O: 832-581-3629
ashley@davis-commercial.com
While we strive to provide the most accurate information, all listing information, and demographic data, is provided by third-parties. As such, MyEListing will not be responsible for the accuracy of the information. It is strongly recommended that you verify all information with the listing agent, and any relevant agencies, prior to making any decisions.