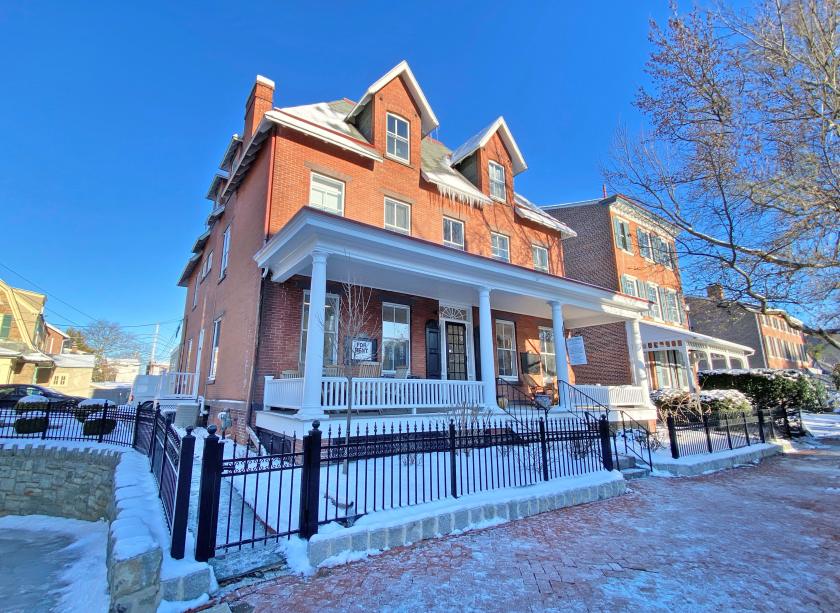
Office Space
107 South Church Street West Chester, PA 19382
107 South Church Street West Chester, PA 19382
Details & Description
Property Highlights
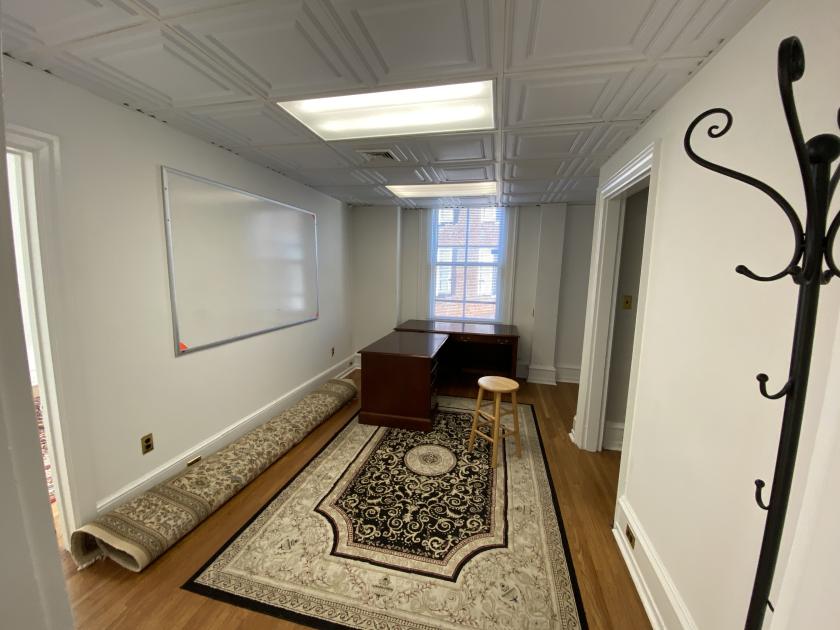
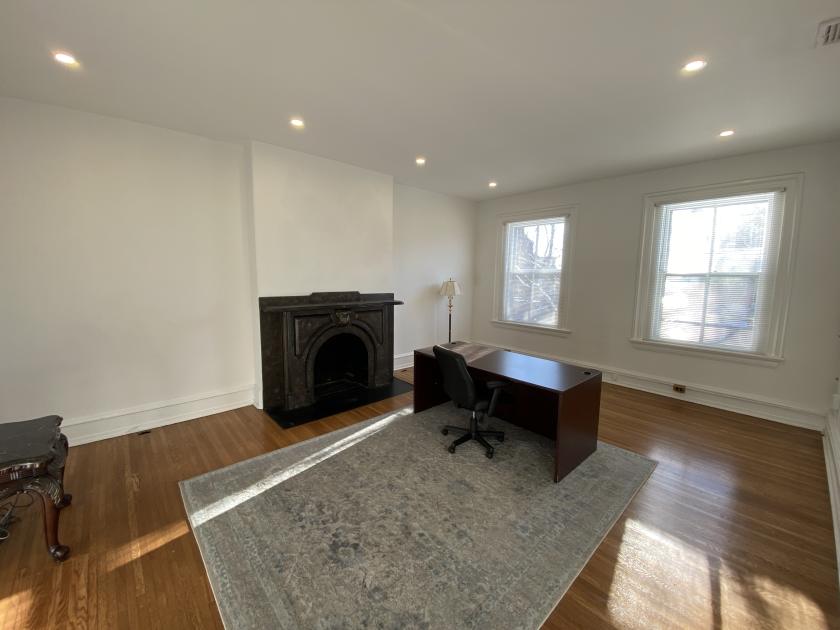
- • All offices were recently updated
- • Hardwood floors
- • Marble bathrooms
- • Large windows
- • Access to a shared conference room
- • Signage available
Additional Photos

Listing Agents

Andrew Turner
O: 484-887-8202
M: 484-888-1825
aturner@pillarrealestateadvisors.com
O: 484-887-8202
M: 484-888-1825
aturner@pillarrealestateadvisors.com
While we strive to provide the most accurate information, all listing information, and demographic data, is provided by third-parties. As such, MyEListing will not be responsible for the accuracy of the information. It is strongly recommended that you verify all information with the listing agent, and any relevant agencies, prior to making any decisions.


