Retail Space
2401 Pecan Street Pflugerville, TX 78660
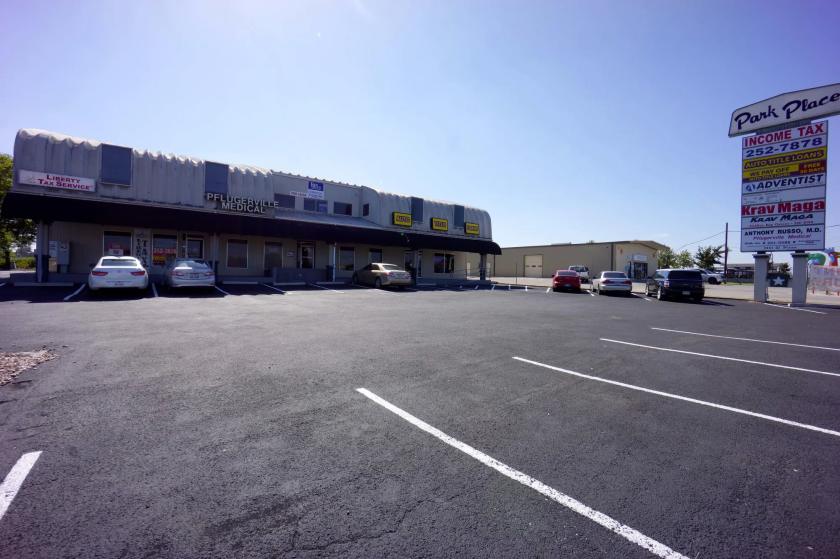
2401 Pecan Street Pflugerville, TX 78660

Details & Description
Property Highlights
• 14,734 SF Retail / Office / Medical Office building with 24 hour access and ample parking for tenants and visitors
• One mile east of IH-35 on FM 1825 (Pecan Street)
Listing Agents

Brent Campbell
O: 512-814-1814
brent@donquick.com
O: 512-814-1814
brent@donquick.com
While we strive to provide the most accurate information, all listing information, and demographic data, is provided by third-parties. As such, MyEListing will not be responsible for the accuracy of the information. It is strongly recommended that you verify all information with the listing agent, and any relevant agencies, prior to making any decisions.