Commercial Land
Peerless St Houston, TX 77021
Peerless St Houston, TX 77021
Details & Description
Property Highlights
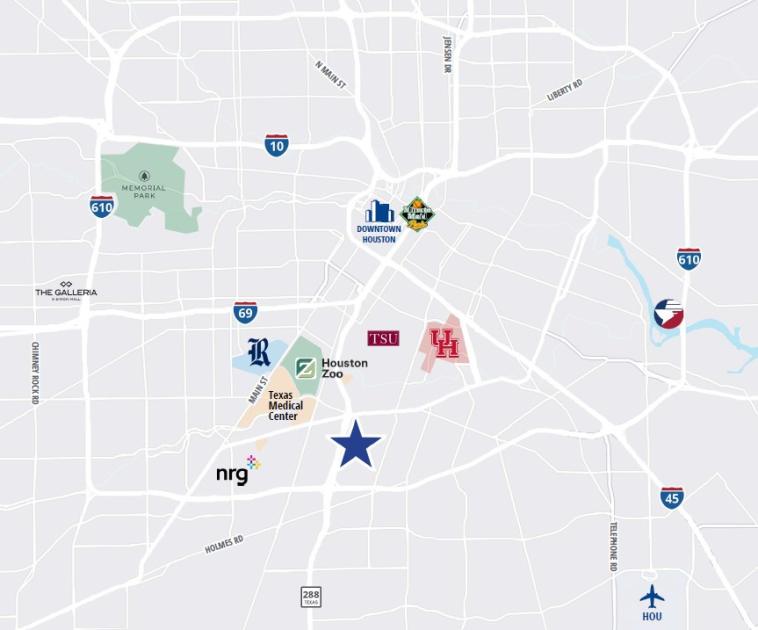
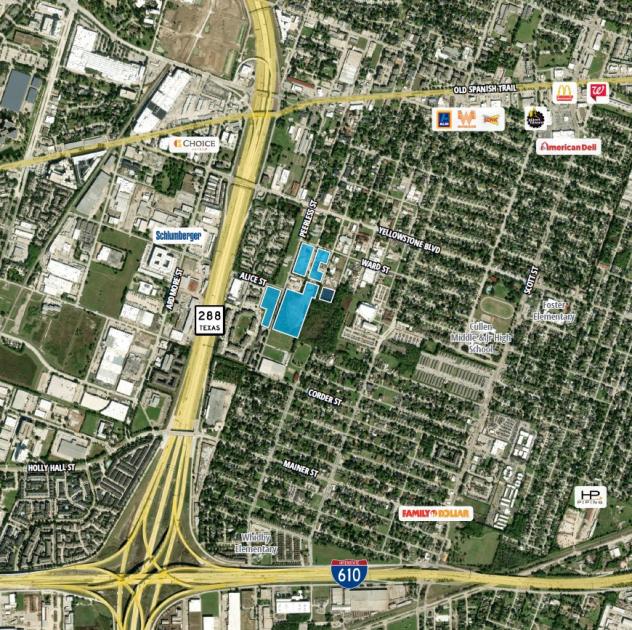
- • Less than 1 mile to Highway 288
- • Less than 2 miles to 610 Loop
- • 2 miles to Houston Medical Center
- • 4 Miles to CBD
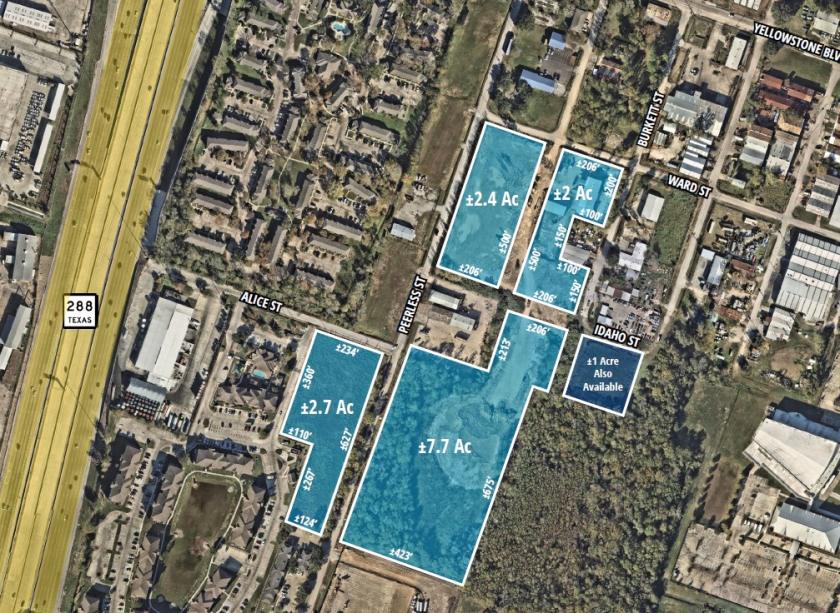
- • ±1,800 ft of frontage on Peerless St.
- • Located in an Opportunity Zone
Listing Agents

Blake Gibson
O: 713-830-2173
blake.gibson@colliers.com
O: 713-830-2173
blake.gibson@colliers.com
While we strive to provide the most accurate information, all listing information, and demographic data, is provided by third-parties. As such, MyEListing will not be responsible for the accuracy of the information. It is strongly recommended that you verify all information with the listing agent, and any relevant agencies, prior to making any decisions.