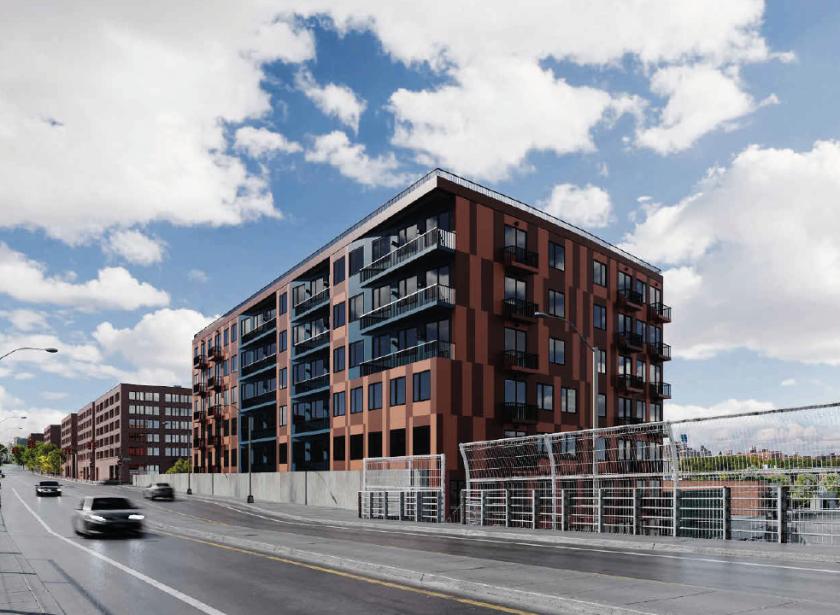
Retail Space
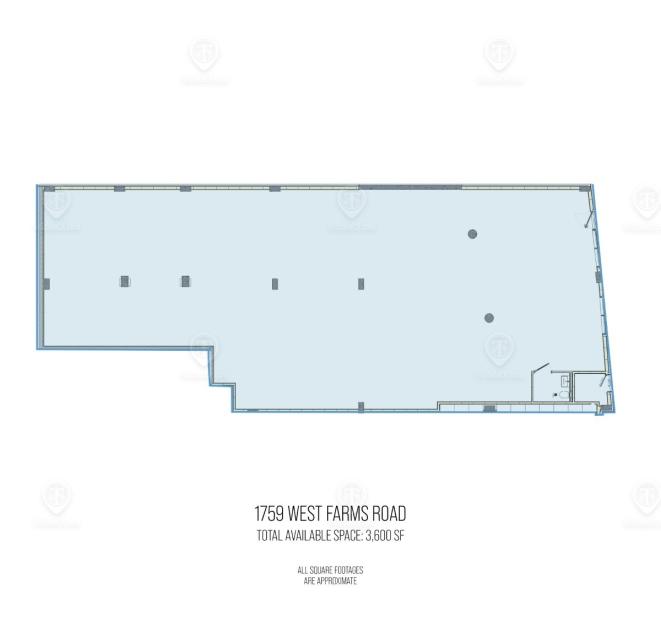
1759 West Farms Road The Bronx, NY 10460
1759 West Farms Road The Bronx, NY 10460

Details & Description
Property Highlights
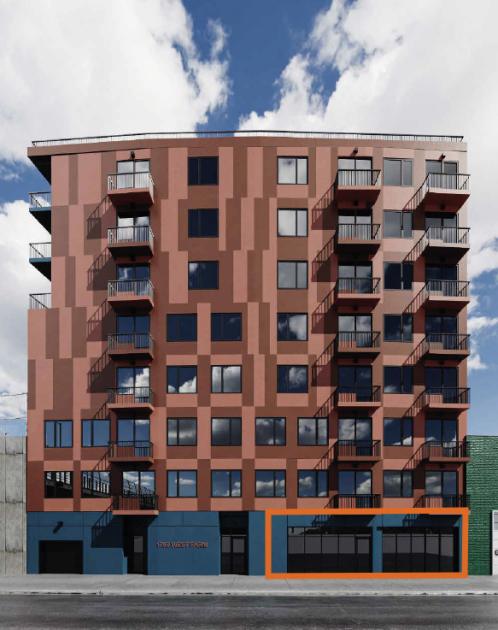
- • Brand new building
- • Finished space
- • All glass frontage with tremendous sunlight
- • Great ceiling heights
- • Parking available
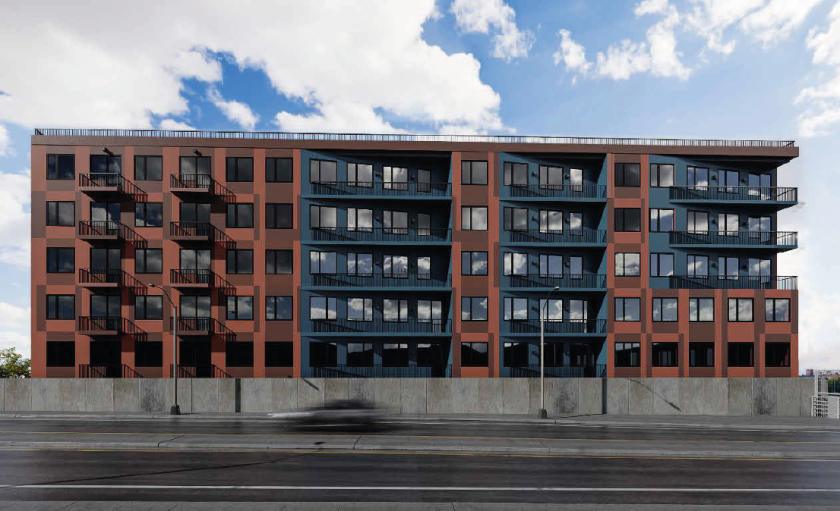
Additional Photos
Listing Agents

Shlomi Bagdadi
O: 718-437-6100
info@tristatecr.com
O: 718-437-6100
info@tristatecr.com
While we strive to provide the most accurate information, all listing information, and demographic data, is provided by third-parties. As such, MyEListing will not be responsible for the accuracy of the information. It is strongly recommended that you verify all information with the listing agent, and any relevant agencies, prior to making any decisions.


