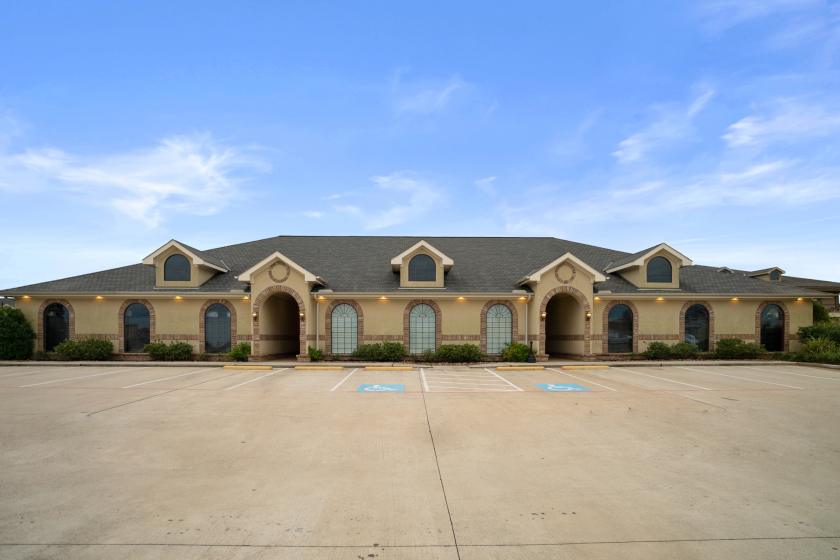
Office Space
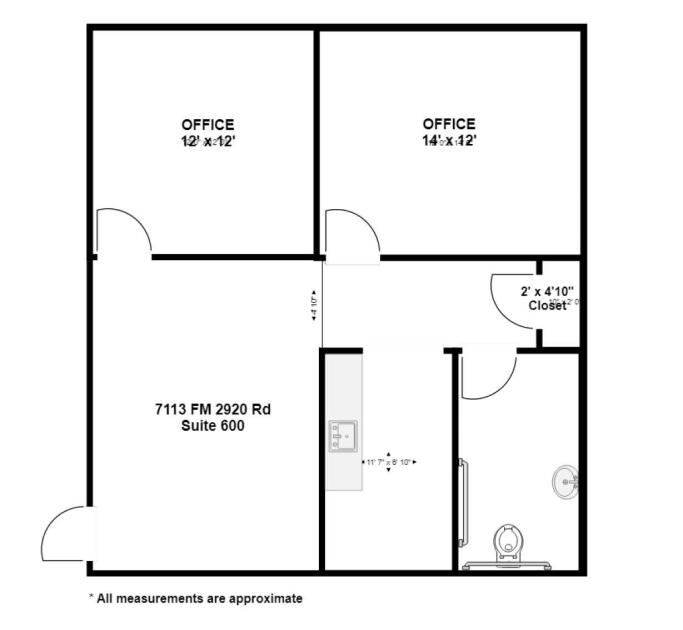
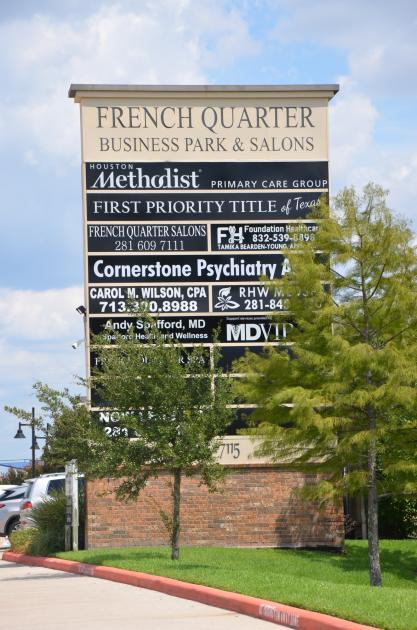
7113 FM 2920 Suite 600 Spring, TX 77379
7113 FM 2920 Suite 600 Spring, TX 77379
Details & Description
Property Highlights
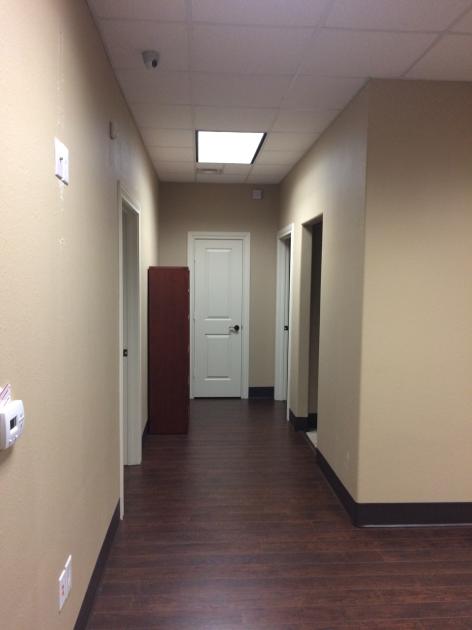
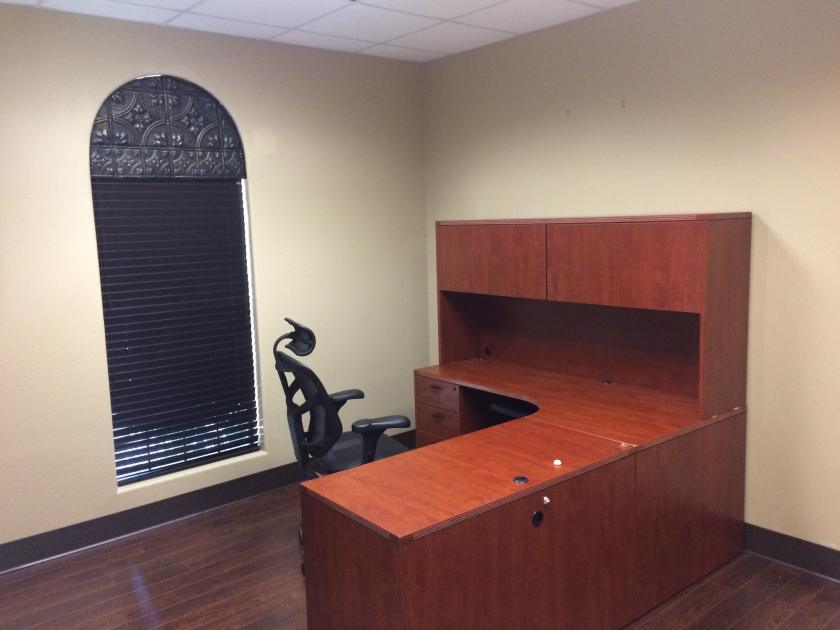
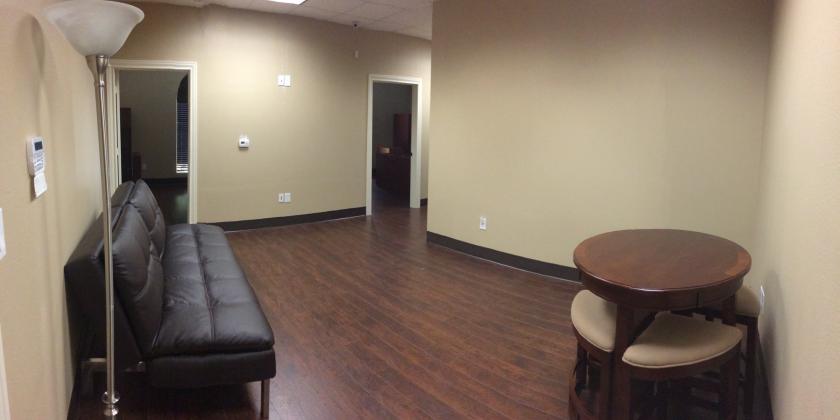
• Includes lobby/reception area, 2 private offices, kitchenette, storage closet, & one ADA restroom
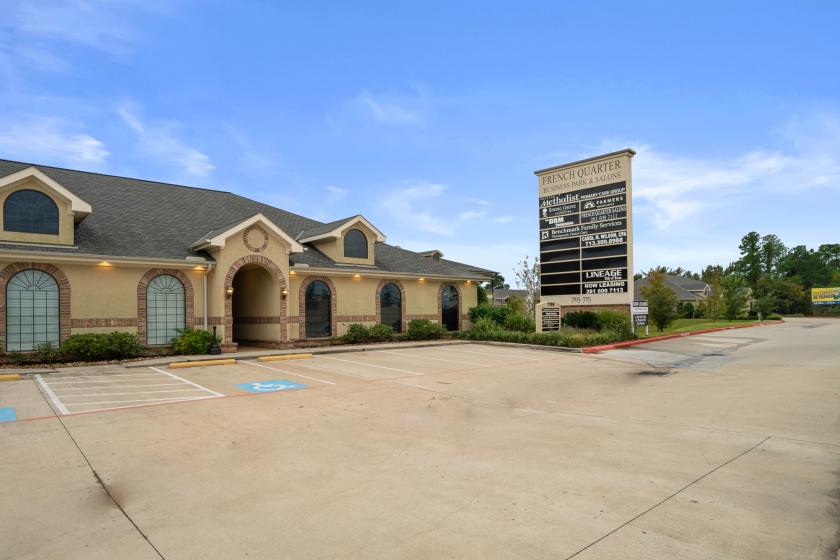
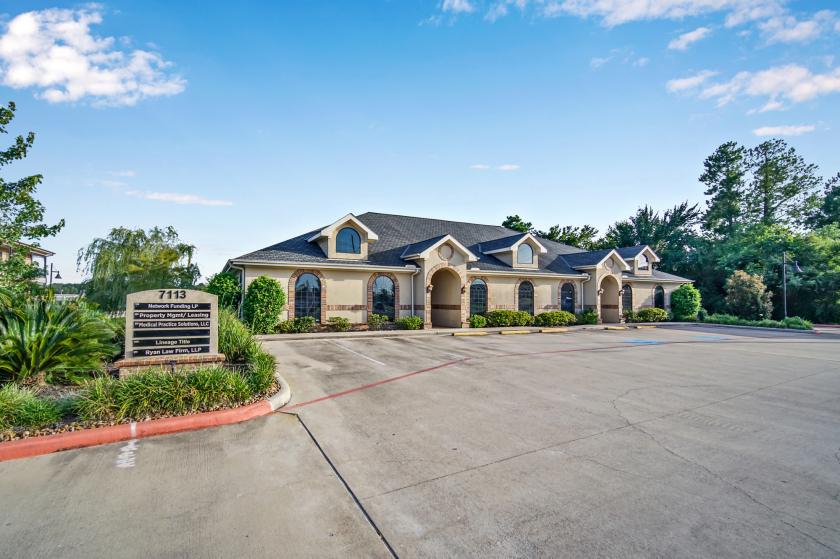
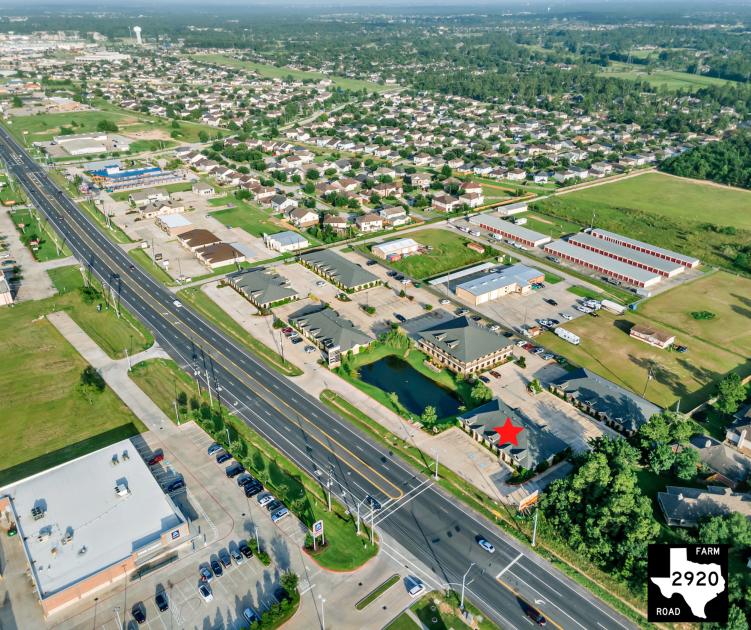
• Located on FM 2920, just west of TC Jester Boulevard, and less than 2 miles east of the Grand Parkway
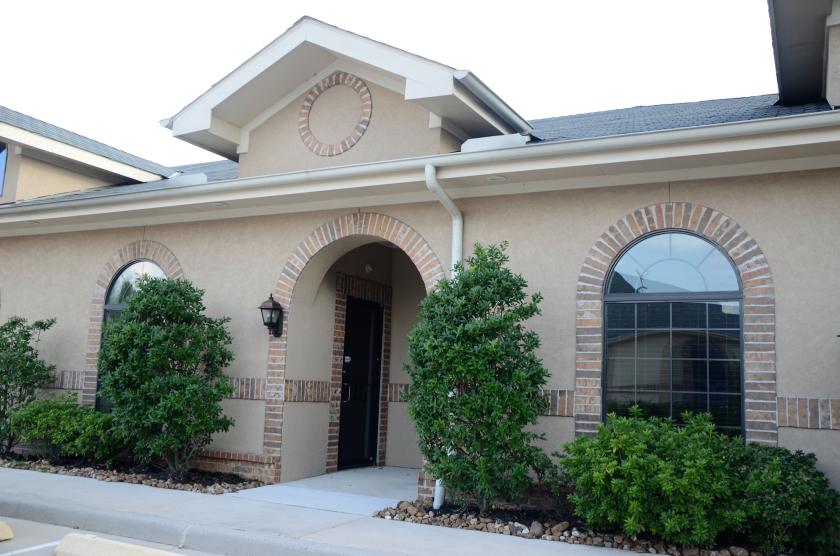
Additional Photos

Listing Agents

Tyler Torres
O: 713-473-7200
M: 281-898-0895
tyler@texascres.com
O: 713-473-7200
M: 281-898-0895
tyler@texascres.com

Brady Becker
O: 713-473-7200
brady@texascres.com
O: 713-473-7200
brady@texascres.com
While we strive to provide the most accurate information, all listing information, and demographic data, is provided by third-parties. As such, MyEListing will not be responsible for the accuracy of the information. It is strongly recommended that you verify all information with the listing agent, and any relevant agencies, prior to making any decisions.