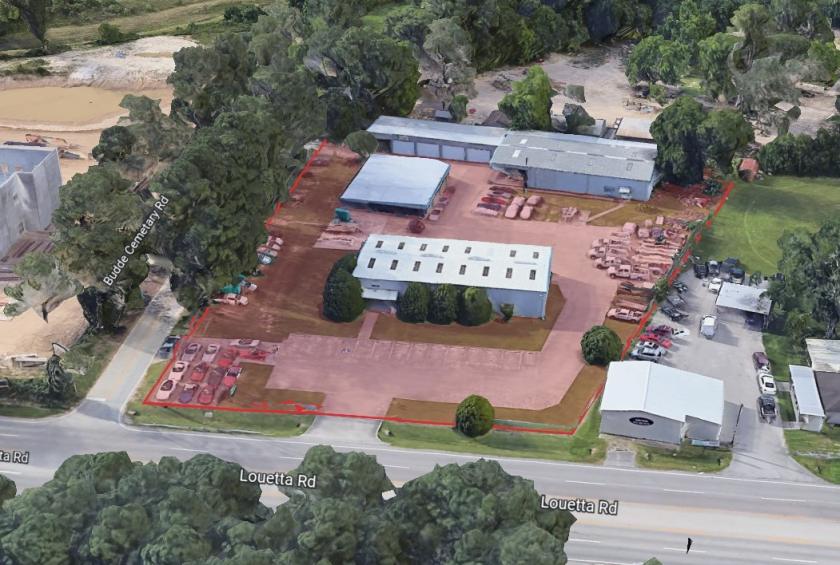
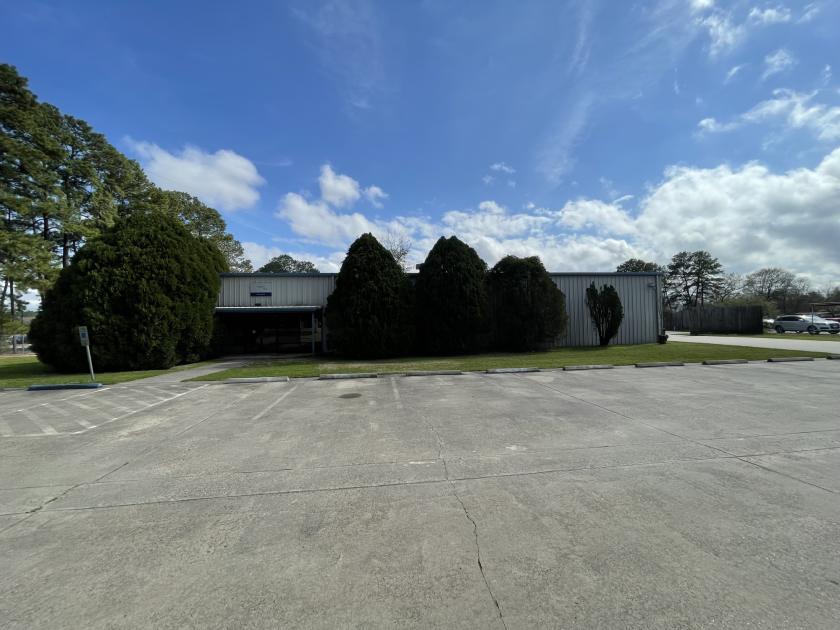
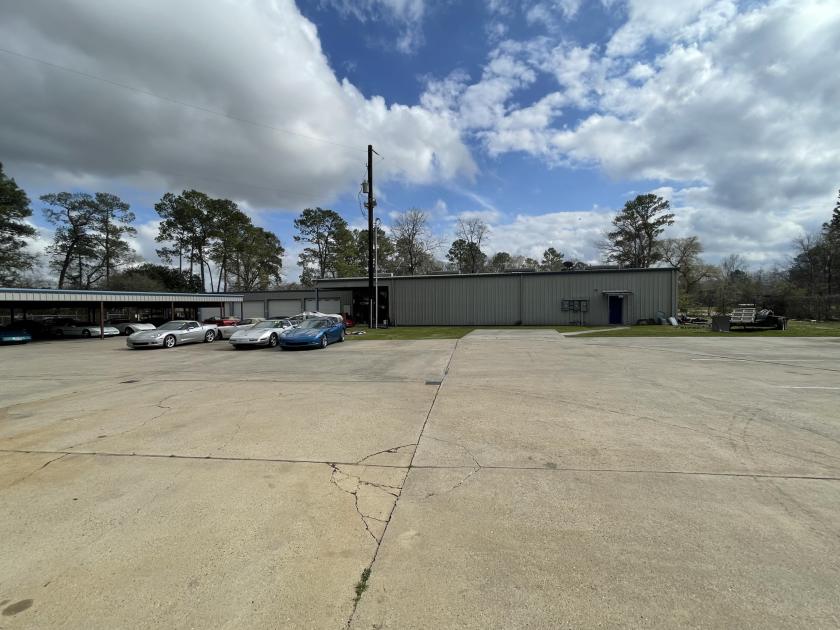
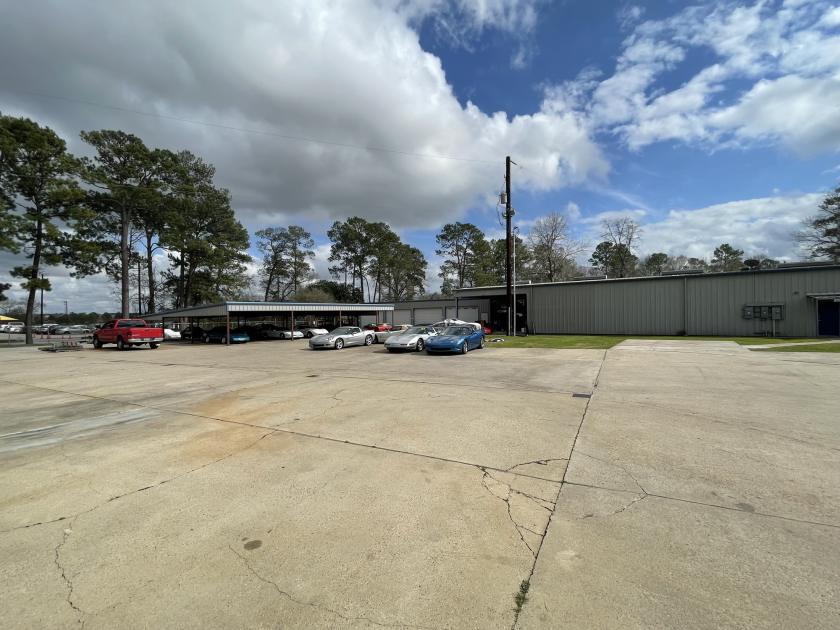
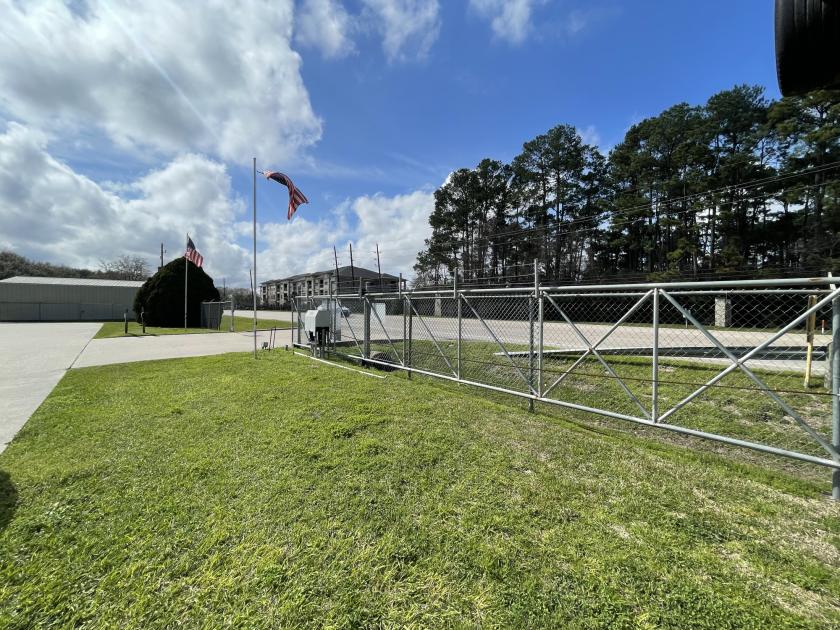
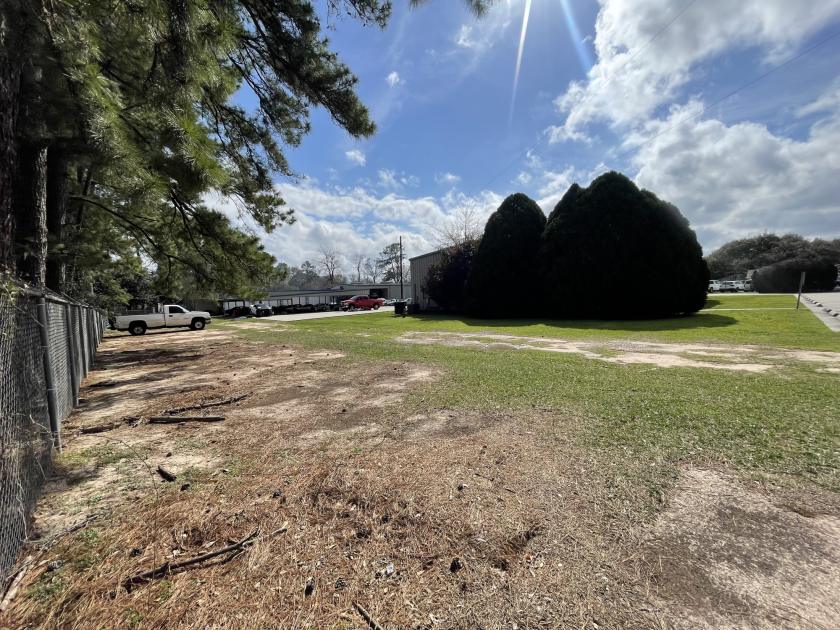
Two office/warehouse buildings totaling 14,725 SF on +/- 1.95 acres of stabilized, fenced, and gated land
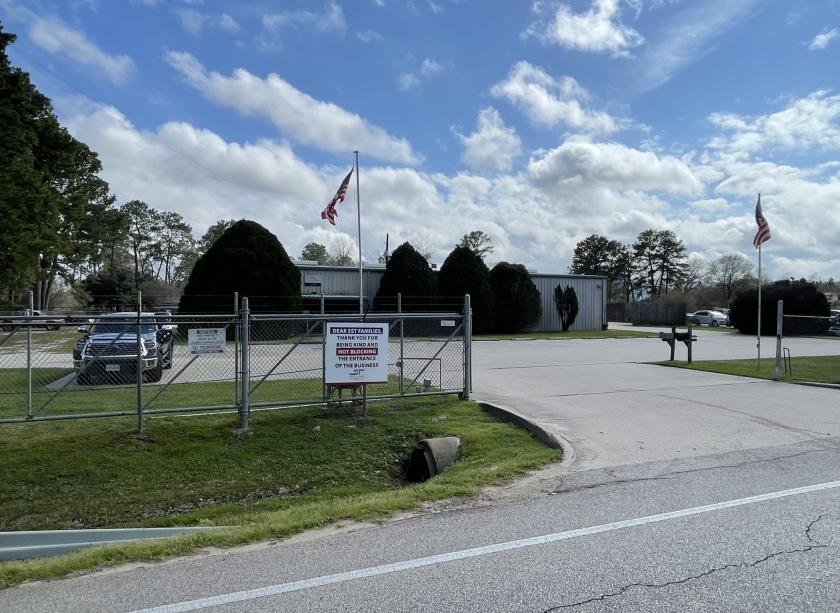
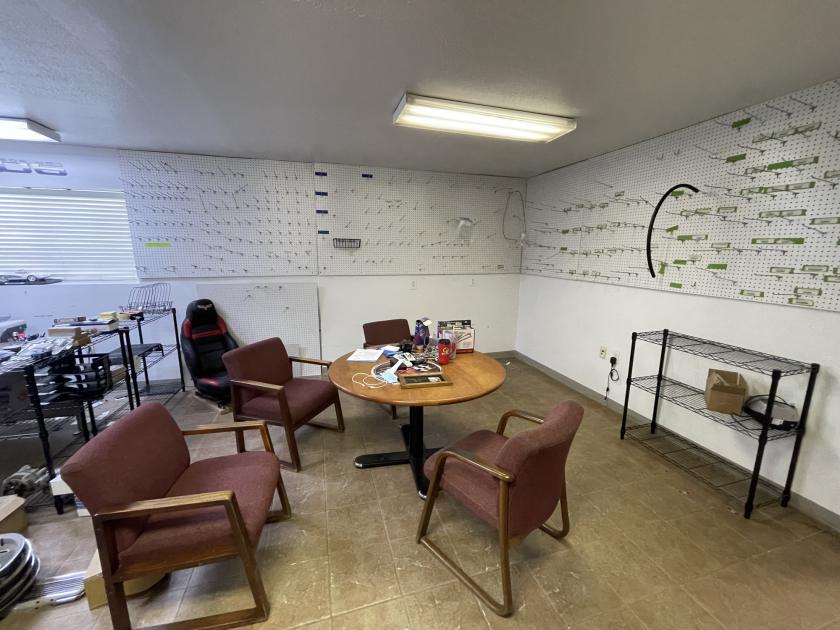
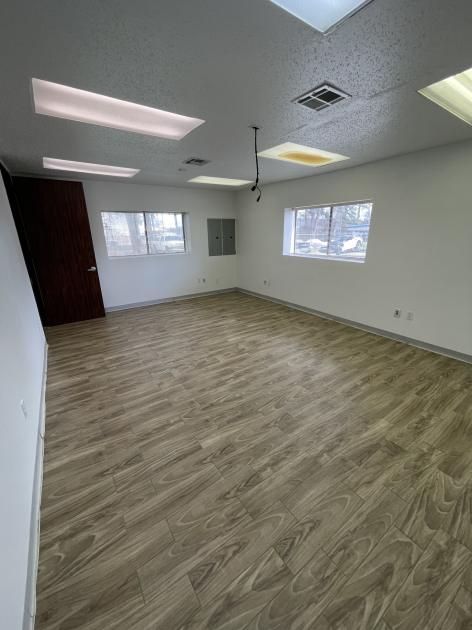
Building 1: +/- 5,000 SF office/flex building with frontage and visibility on Louetta Road
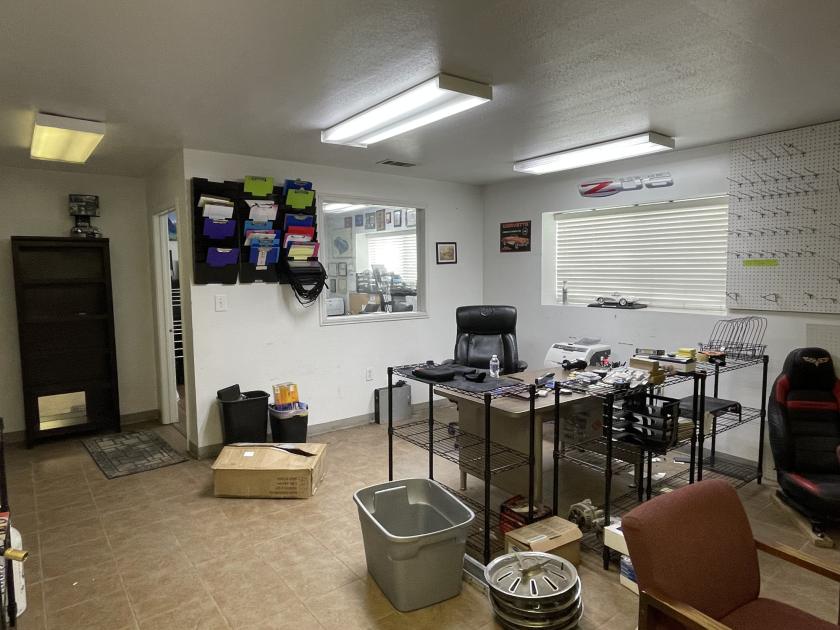
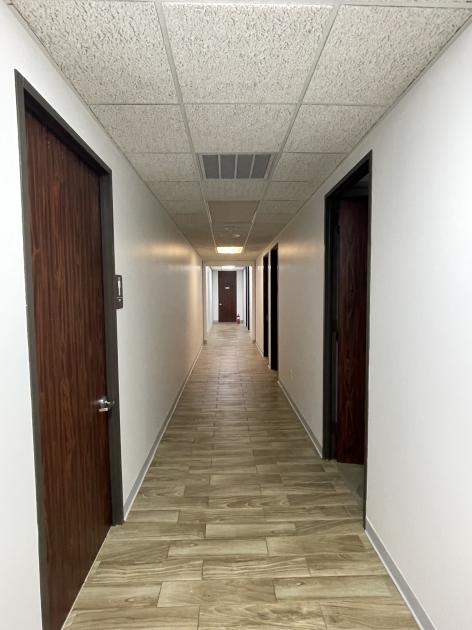
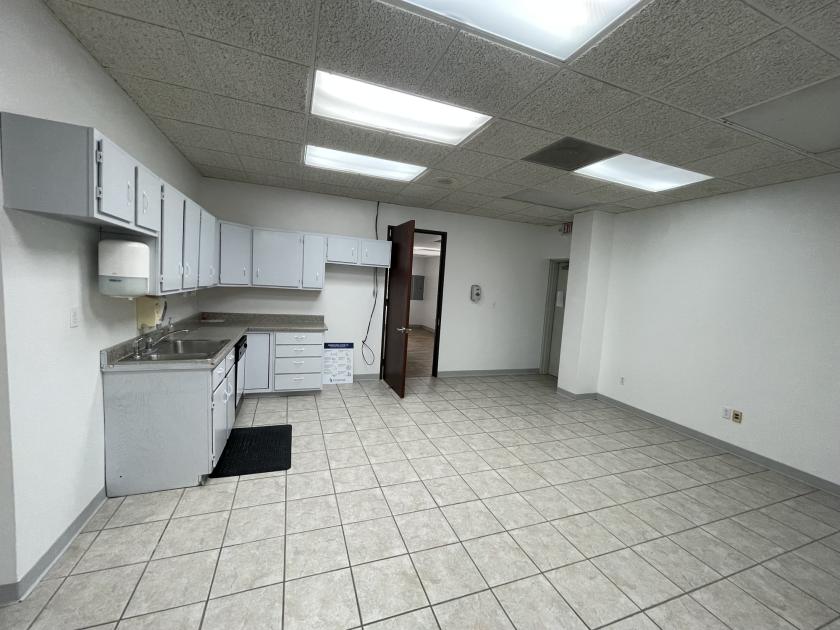
Includes 8-10 private offices, conference room, large kitchenette/breakroom, IT closet, attached warehouse, etc.
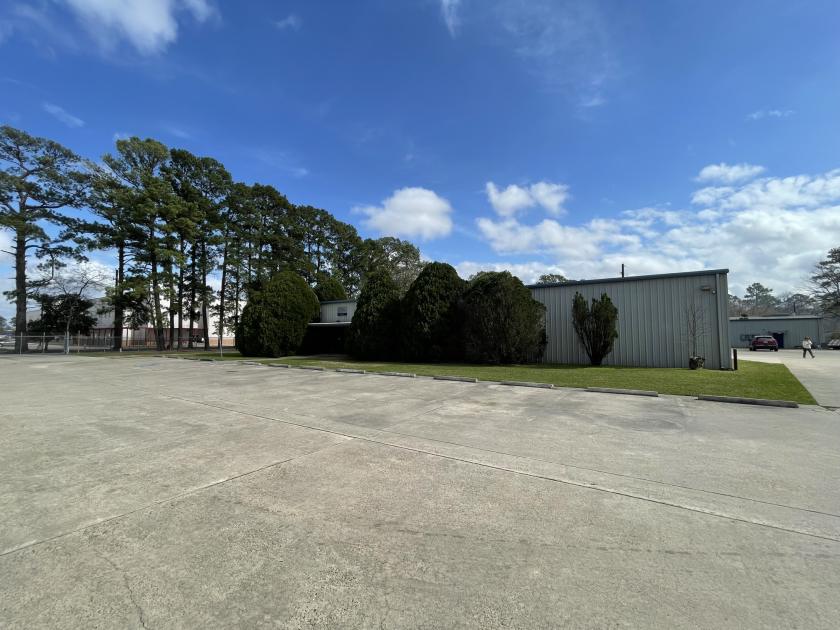
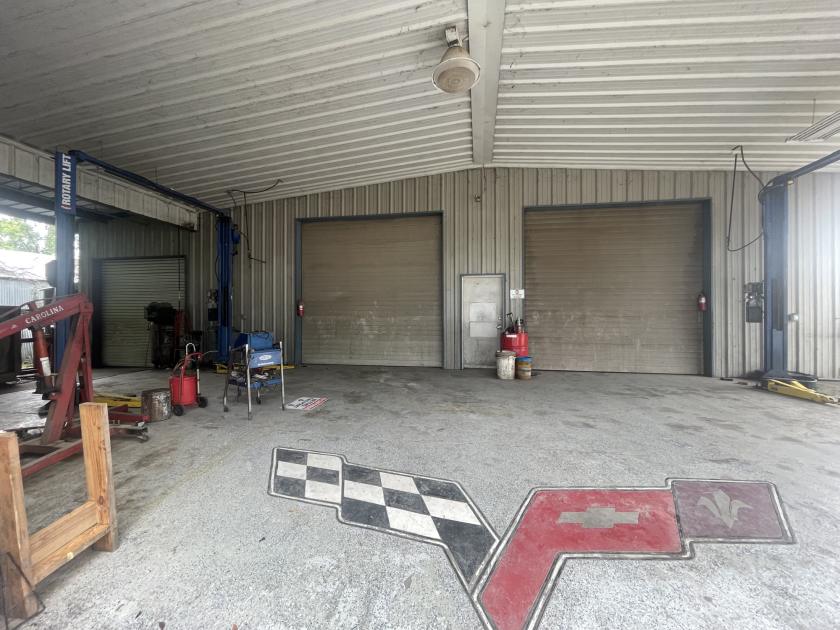
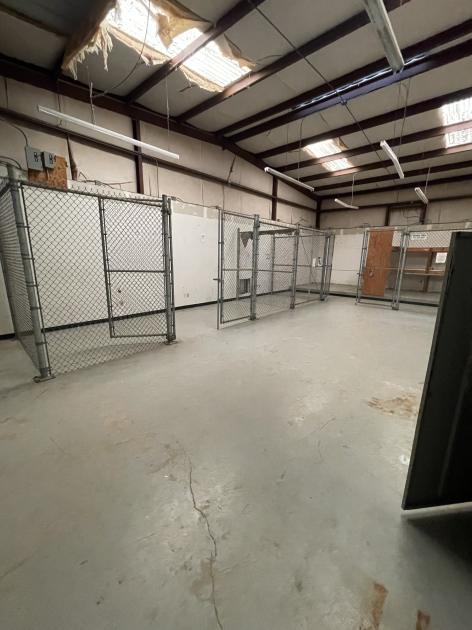
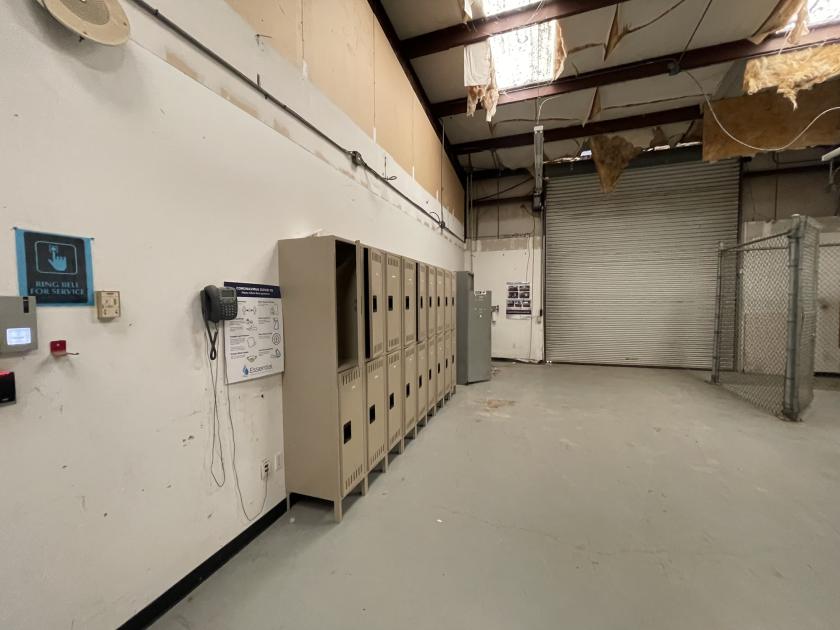
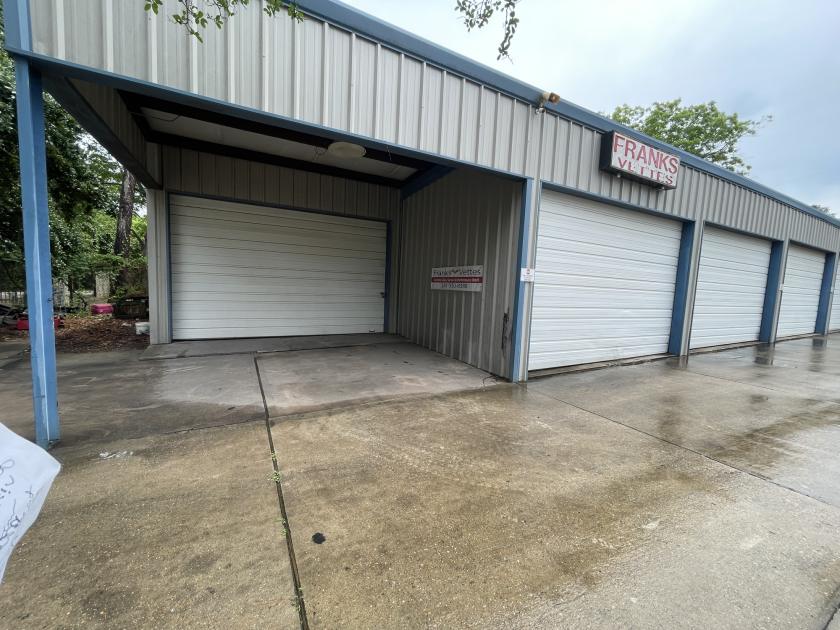
Building 2: +/- 9,715 SF office/warehouse building previously used as an auto shop with a 14' clear height, et
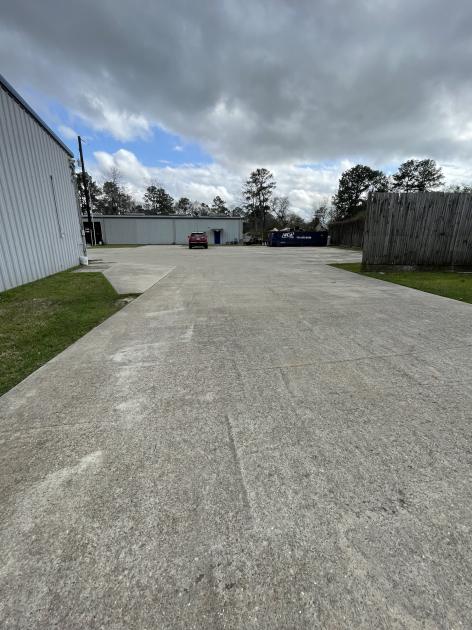
Over 23,000 SF paved area with +/- 3,800 SF covered carport between the two buildings
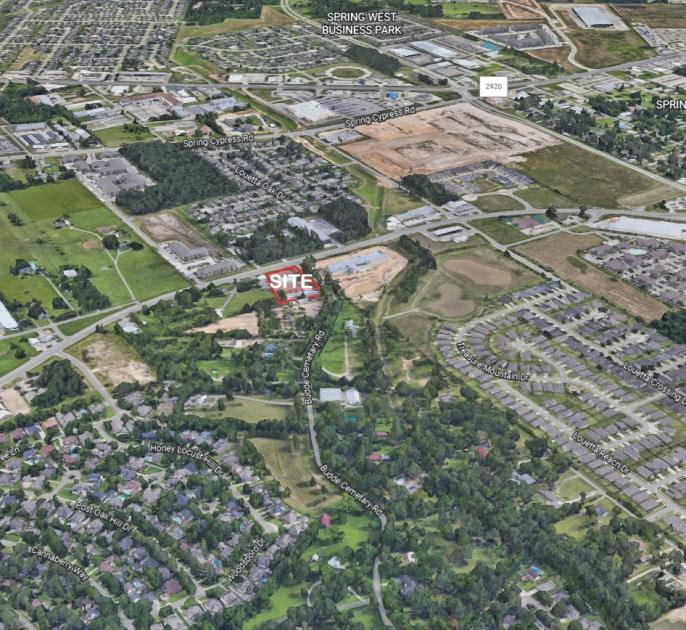
Great site for industrial/retail uses and/or future re-development
Excellent location with +/- 193 feet of frontage on Louetta Road and +/- 365 feet of frontage on Budde Cemetary Road
Gated ingress/egress points to the property currently available from both Louetta Road and Budde Cemetary Road
Located only one mile west of Interstate 45
Average traffic of over 35,000 vehicles per day on Louetta Road
Located in Harris County and Klein ISD with a total tax rate for 2022 of $2.00 per $100.00 of assessed value
••Property tours by appointment only••
No part of this information may be copied, reproduced, repurposed, or screen-captured for any commercial purpose without prior written authorization from MyEListing.
While we strive to provide the most accurate information, all listing information, and demographic data, is provided by third-parties. As such, MyEListing will not be responsible for the accuracy of the information. It is strongly recommended that you verify all information with the listing agent, and any relevant agencies, prior to making any decisions.
What is the building size of this Industrial property in Spring, TX?
The size of the building/unit at 2211 Louetta Road in Spring is 14,725 square feet
How much land does the Spring, TX property at 2211 Louetta Road include?
2211 Louetta Road in Spring includes 1.950 acres of land
What kind of Industrial is the propery at 2211 Louetta Road?
The property at 2211 Louetta Road Spring, TX 77388 is listed as a Flex-Office-Warehouse Industrial property
What is the population within 1 mile of 2211 Louetta Road in Spring?
The population within 1 mile of 2211 Louetta Road Spring, TX 77388 is 11,590 people.
Who do I contact for questions about 2211 Louetta Road?
You should contact the listing agent,
Tyler Torres, for any details regarding this commercial listing.