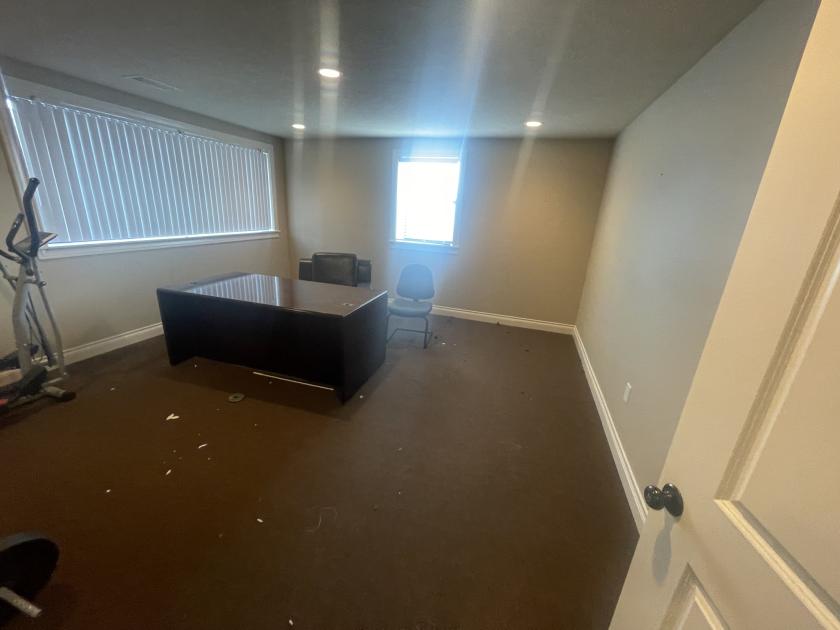
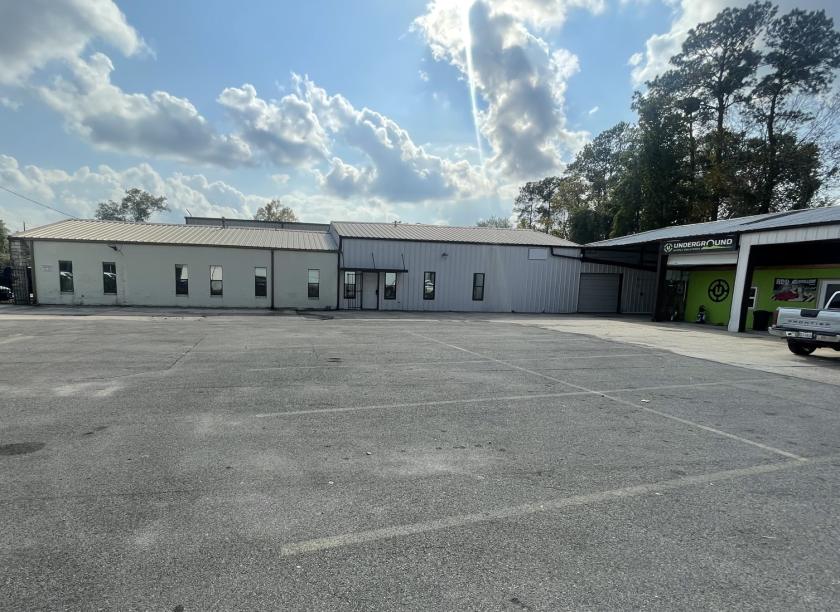
Office Space
18025 Hufsmith - Kohrville Road Tomball, TX 77375
18025 Hufsmith - Kohrville Road Tomball, TX 77375
Details & Description
Property Highlights
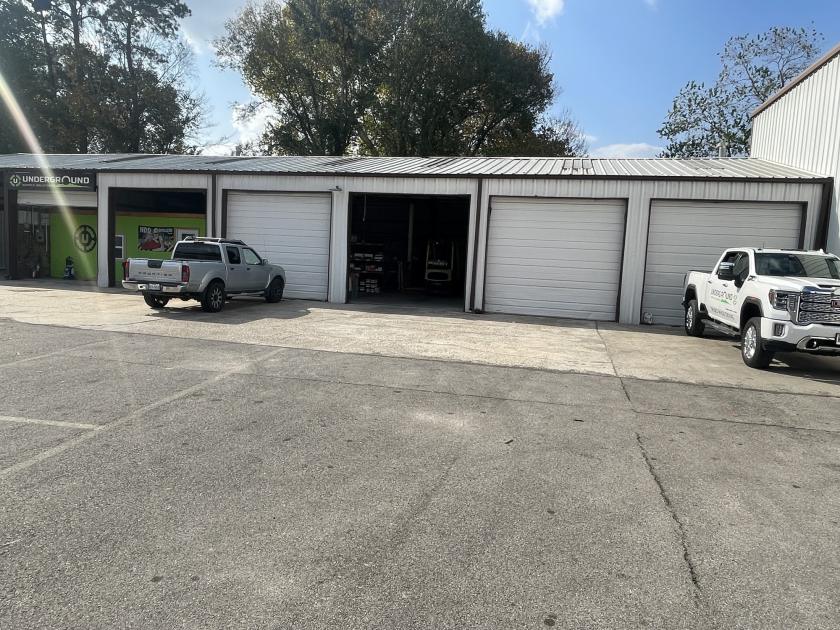
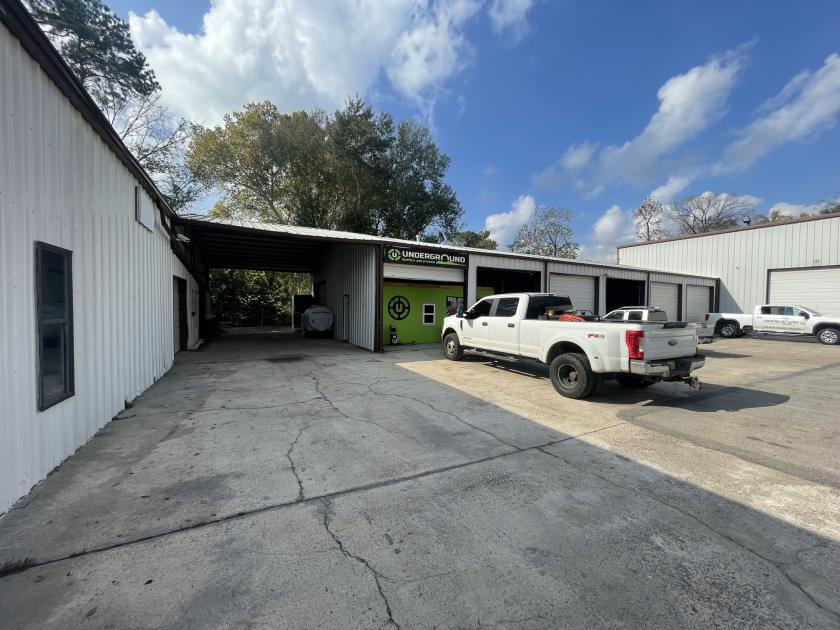
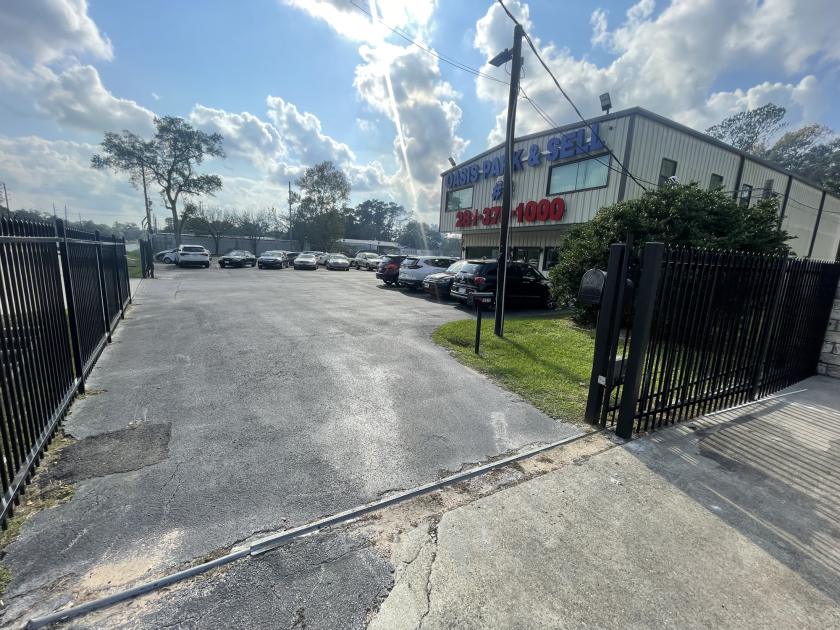
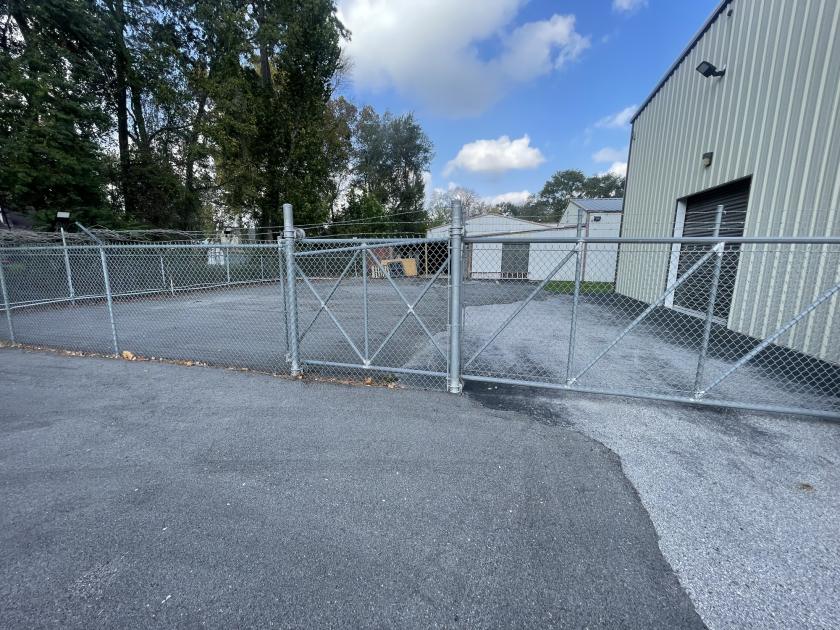
• Fully fenced and gated property; gated and paved yard/parking area also available for lease behind main building
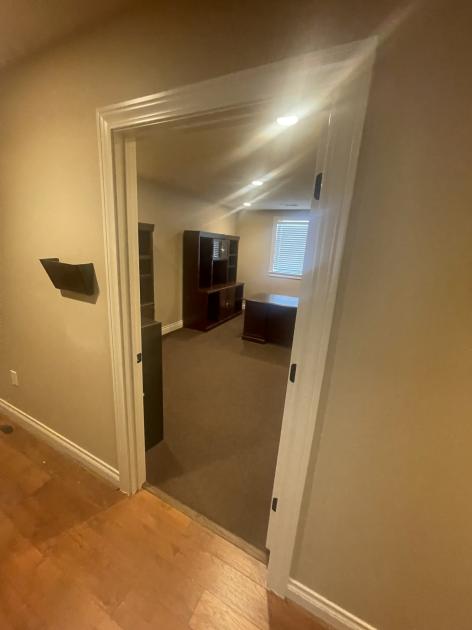
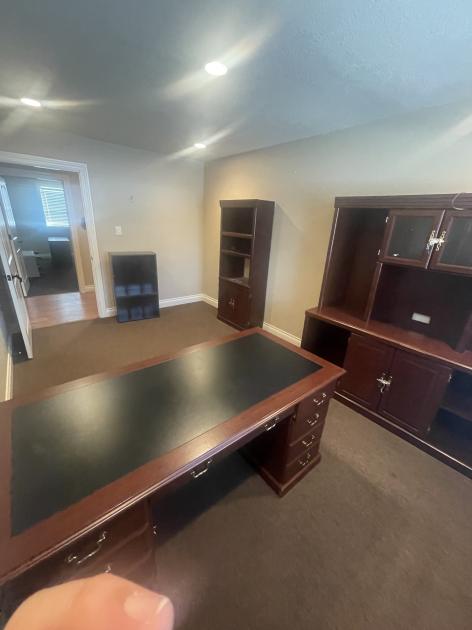
• 3,200 SF warehouse with private office and 6 grade level roll-up doors also available for lease
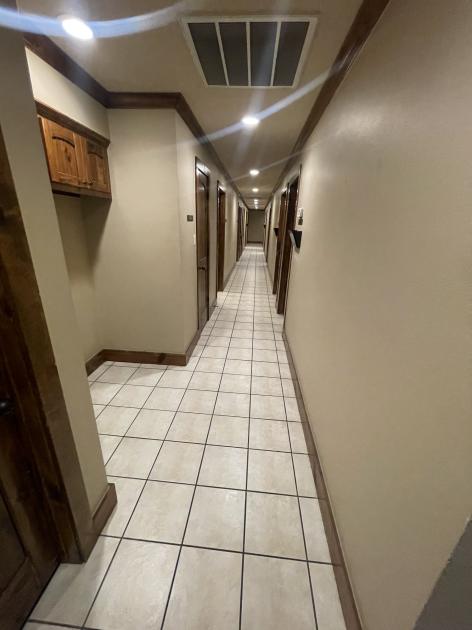
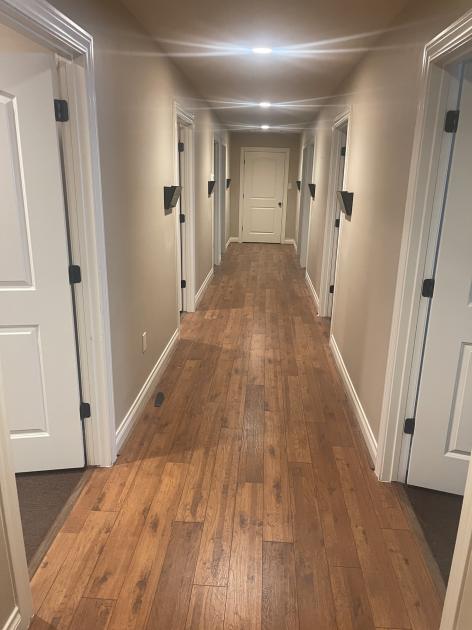
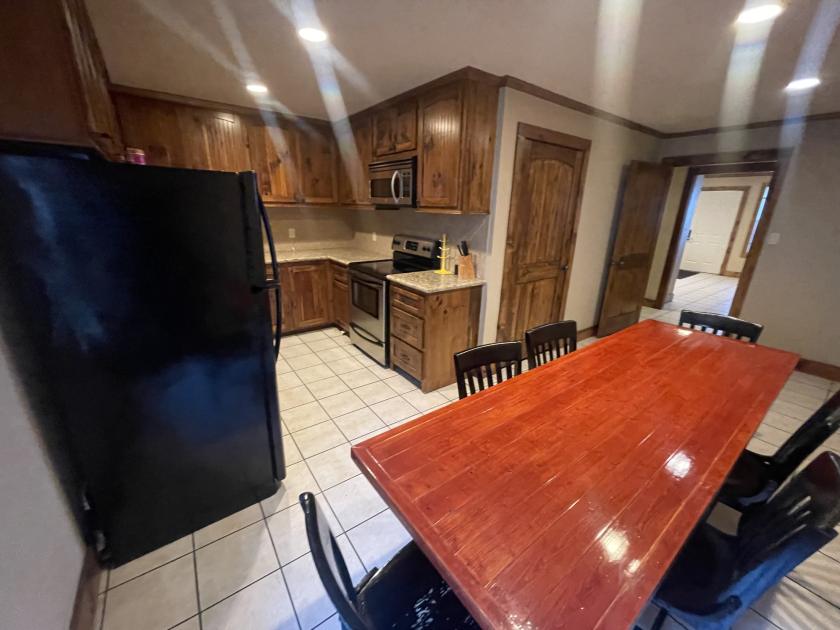
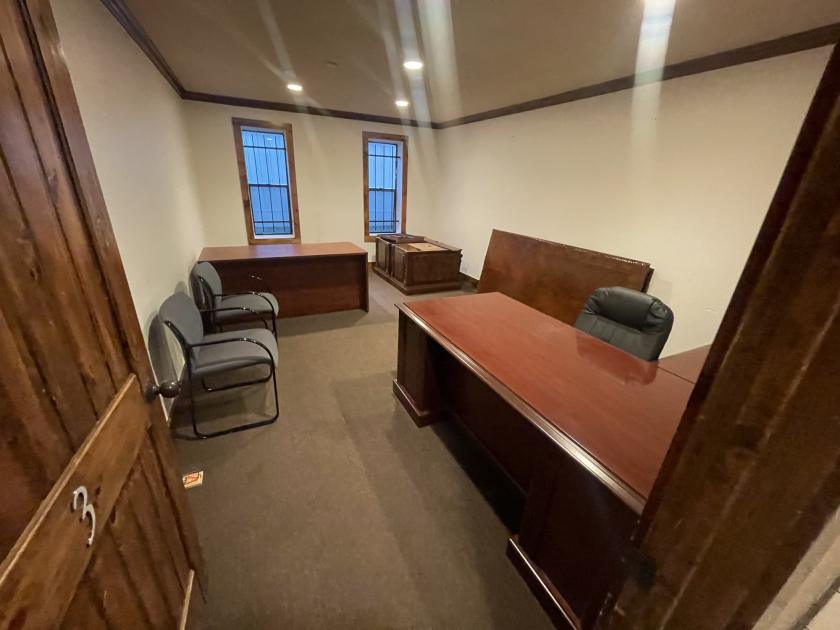
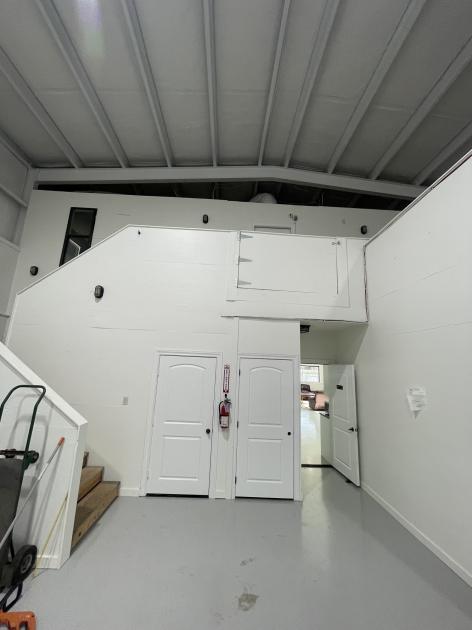
Additional Photos
Listing Agents

Tracy Eddy
O: 713-473-7200
M: 713-907-1707
tracy@texascres.com
O: 713-473-7200
M: 713-907-1707
tracy@texascres.com
While we strive to provide the most accurate information, all listing information, and demographic data, is provided by third-parties. As such, MyEListing will not be responsible for the accuracy of the information. It is strongly recommended that you verify all information with the listing agent, and any relevant agencies, prior to making any decisions.