Industrial Properties
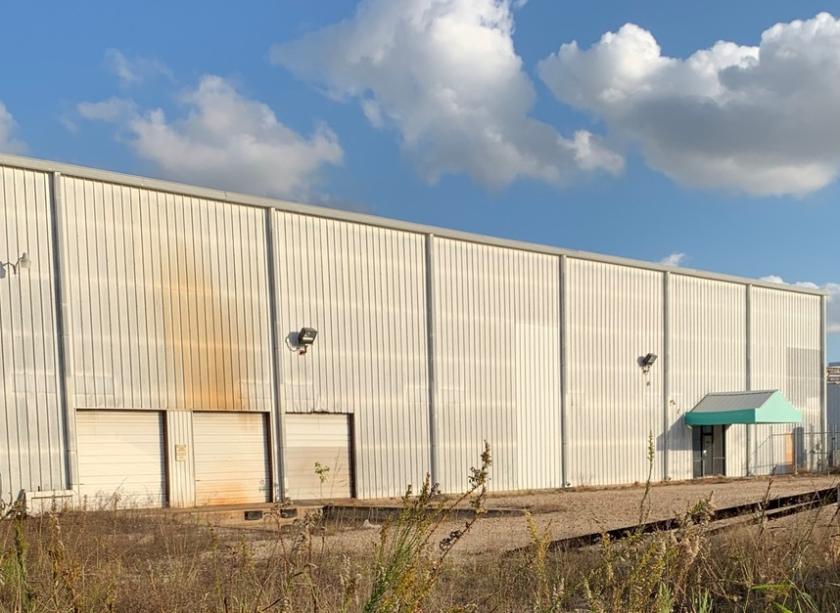
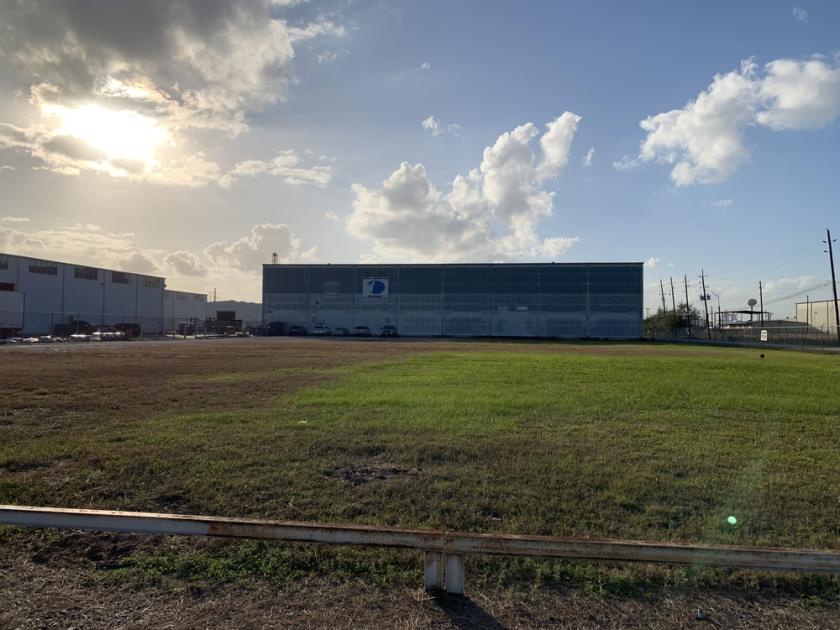
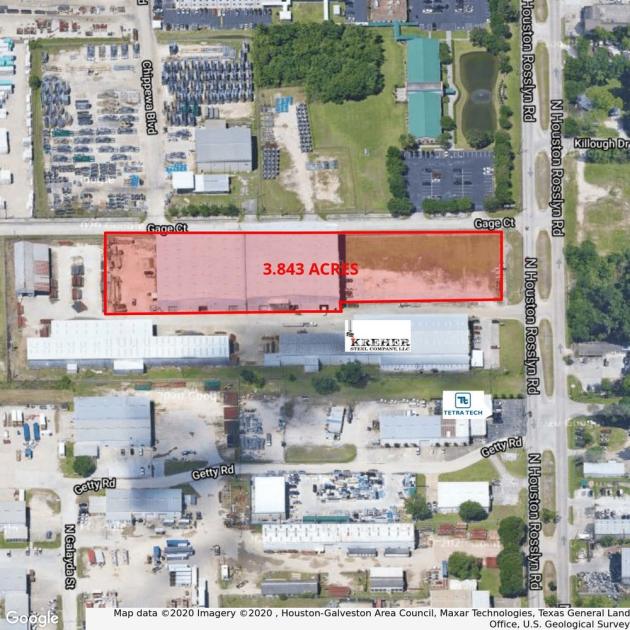
11629 North Houston Rosslyn Road Houston, TX 77086
11629 North Houston Rosslyn Road Houston, TX 77086
Details & Description
Property Highlights
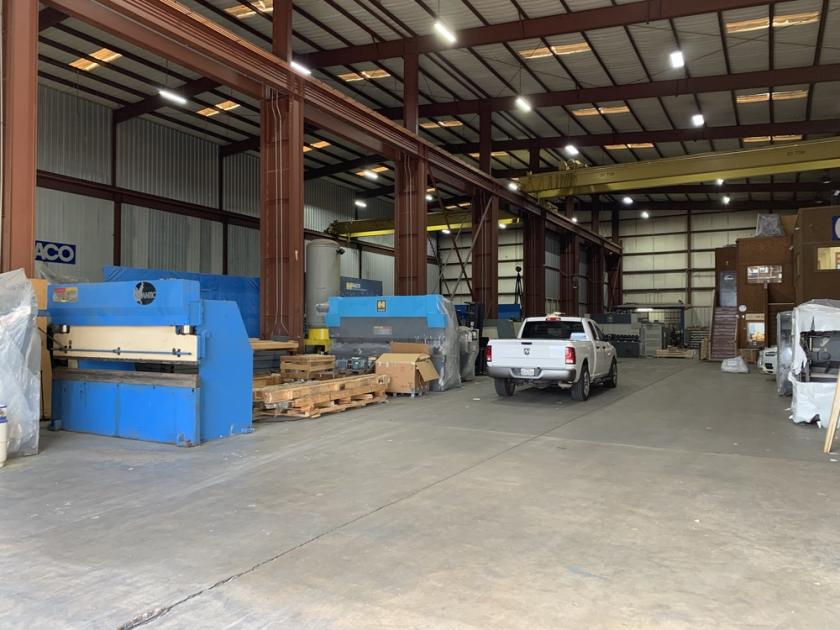
- • Four (4) overhead cranes
- • Heavy power throughout the building
- • Water well & septic
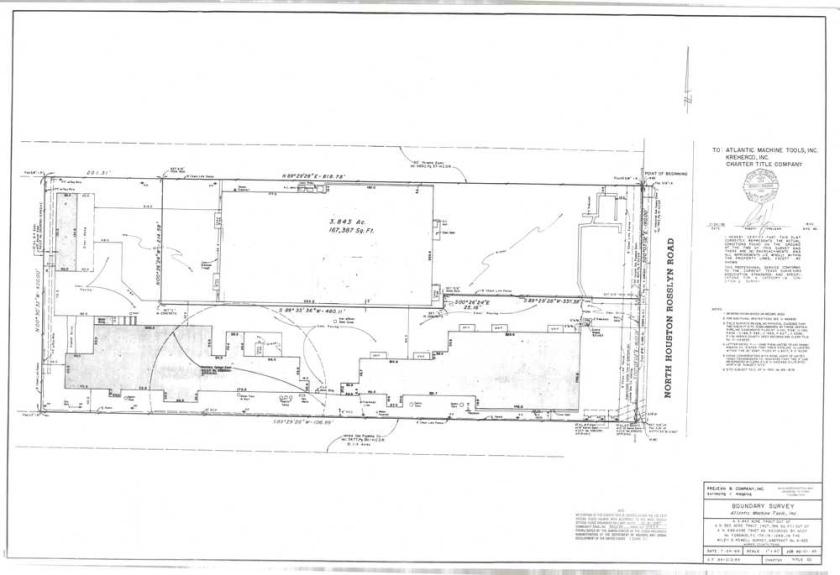
- • Fully fenced and stabilized yard
- • Two truck wells; seven grade level doors
Additional Photos
Listing Agents

Tracy Eddy
O: 713-473-7200
M: 713-907-1707
tracy@texascres.com
O: 713-473-7200
M: 713-907-1707
tracy@texascres.com
While we strive to provide the most accurate information, all listing information, and demographic data, is provided by third-parties. As such, MyEListing will not be responsible for the accuracy of the information. It is strongly recommended that you verify all information with the listing agent, and any relevant agencies, prior to making any decisions.


