Commercial Land
6535 FM 2920 Spring, TX 77379
6535 FM 2920 Spring, TX 77379

Details & Description
Property Highlights
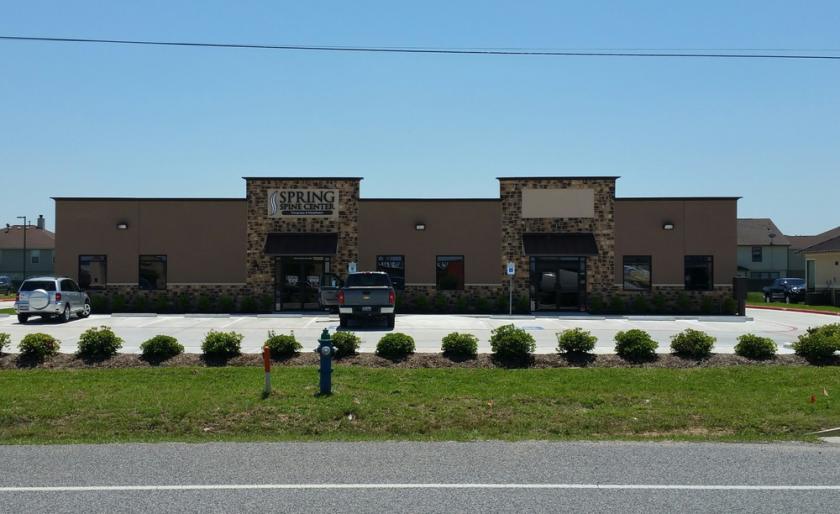
• Up to 4,000 SF Professional Office Building with Custom Interior Build-To-Suit also Available
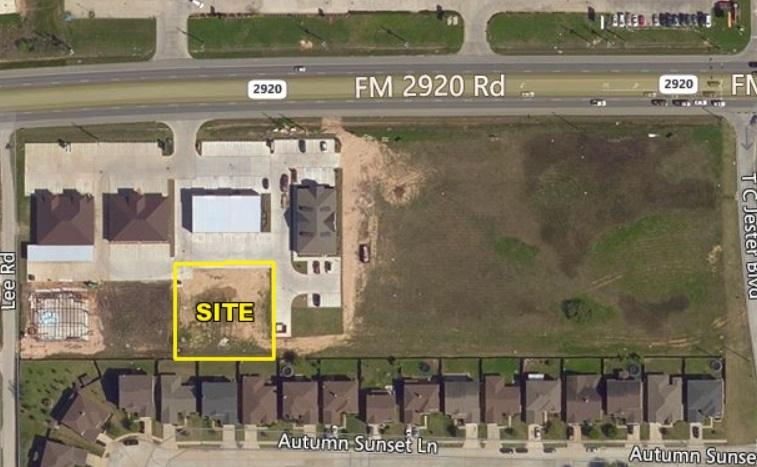
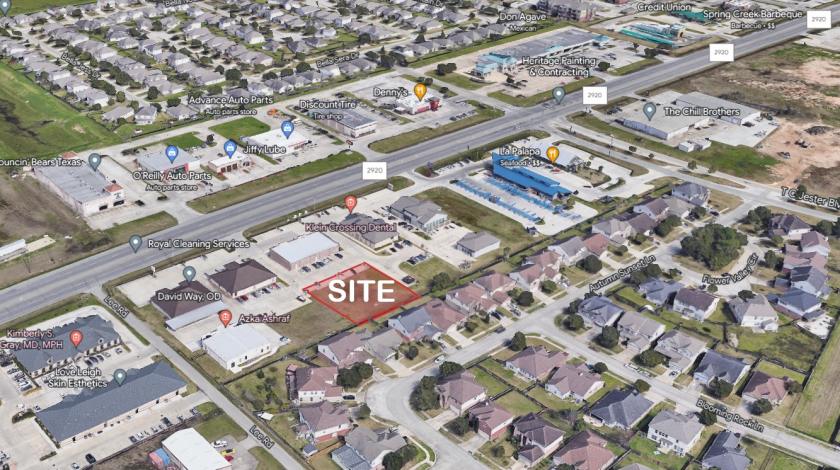
• Located on FM 2920 near TC Jester; West of Kuykendahl, a short distance from The Woodlands
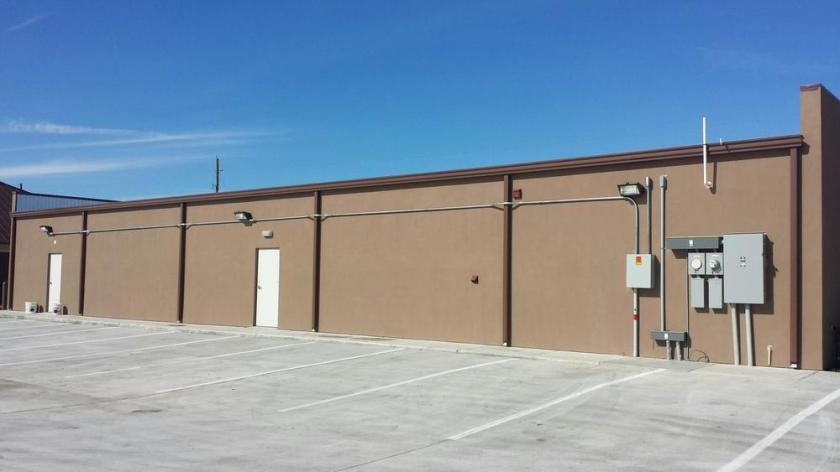
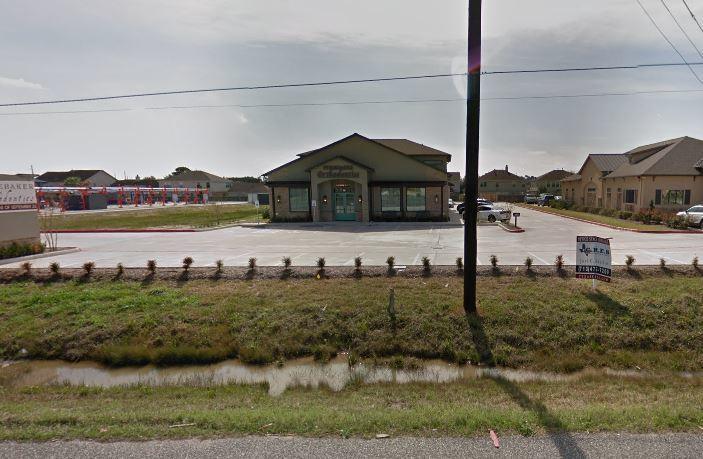
Additional Photos


Listing Agents

Joel English
O: 713-473-7200
joel@texascres.com
O: 713-473-7200
joel@texascres.com
While we strive to provide the most accurate information, all listing information, and demographic data, is provided by third-parties. As such, MyEListing will not be responsible for the accuracy of the information. It is strongly recommended that you verify all information with the listing agent, and any relevant agencies, prior to making any decisions.