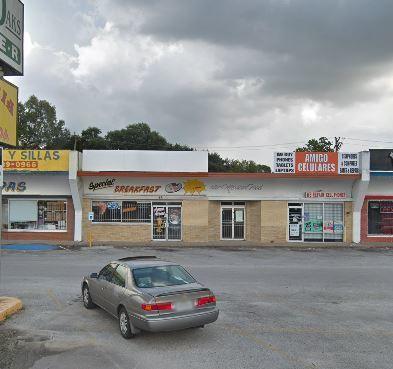
1-Mile | 3-Miles | 5-Miles | ||
---|---|---|---|---|
Total Population | 18,329 | 136,792 | 306,313 | |
Population Median Age | 32 | 32 | 33 | |
Population by Age | 0-9 Yrs | 3405 (18%) | 23994 (17%) | 51096 (16%) |
10-19 Yrs | 3222 (17%) | 24164 (17%) | 52019 (16%) | |
20-29 Yrs | 2677 (14%) | 21613 (15%) | 47562 (15%) | |
30-39 Yrs | 2725 (14%) | 18001 (13%) | 40390 (13%) | |
40-49 Yrs | 2006 (10%) | 17414 (12%) | 39240 (12%) | |
50-59 Yrs | 2100 (11%) | 16003 (11%) | 35479 (11%) | |
60-69 Yrs | 1135 (6%) | 8776 (6%) | 23171 (7%) | |
70+ Yrs | 1059 (5%) | 6826 (4%) | 17356 (5%) | |
Median HH Income | $48,152 | $48,176 | $48,769 | |
Total Household Income | < 24K | 1186 (23%) | 9601 (23%) | 22451 (23%) |
25-49K | 1454 (28%) | 11114 (27%) | 25680 (27%) | |
50-74K | 1028 (20%) | 7995 (19%) | 18702 (19%) | |
75-99K | 626 (12%) | 5013 (12%) | 12362 (13%) | |
100-199K | 631 (12%) | 5868 (14%) | 13408 (14%) | |
200K+ | 120 (2%) | 620 (1%) | 1661 (1%) | |
Highest Education Level | No Diploma | 4063 | 29802 | 62032 |
Diploma or GED | 3255 | 25251 | 58165 | |
Some College | 1853 | 12589 | 31934 | |
Assoc. Degree | 693 | 4414 | 9527 | |
Bachelors Degree | 383 | 4514 | 13810 | |
Higher Degree | 151 | 1384 | 4432 | |
Total Housing Units | 5,830 | 44,884 | 105,245 | |
--Owner-Occupied | 2,640 | 19,366 | 45,054 | |
--Renter-Occupied | 2,405 | 20,845 | 49,209 | |
Owner-Occupied Values | < 100K | 1373 | 9386 | 18322 |
100-199K | 1129 | 8677 | 21835 | |
200-299K | 88 | 1025 | 3581 | |
300-399K | 17 | 164 | 652 | |
400-499K | 30 | 55 | 316 | |
500K+ | 2 | 60 | 348 | |
Total Working Age Population | 12,913 | 97,920 | 223,061 | |
In Work Force | 8,416 | 64,765 | 146,059 | |
Not In Work Force | 4,498 | 33,156 | 77,002 | |
Workforce Employed | 7,490 | 58,592 | 133,216 | |
Workforce Unemployed | 923 | 6,157 | 12,809 | |
Civlian Workforce | 8,413 | 64,750 | 146,025 | |
Military Workforce | 3 | 15 | 34 | |
Total Households | 5,045 | 40,212 | 94,263 | |
Family Households | 4,060 | 31,165 | 70,314 | |
Non-Family Households | 984 | 9,046 | 23,950 | |
Married Couple | 2,713 | 20,332 | 44,705 | |
Other Family | 1,347 | 10,833 | 25,609 | |
Married w/Child | 1,360 | 10,480 | 22,208 | |
Single Male w/Child | 168 | 1,628 | 3,655 | |
Single Female w/Child | 640 | 4,710 | 10,501 |
Population Change Last Two Decades - Plus Projection
2000 | % | 2010 | % | 2020 | % | 2030 | |
---|---|---|---|---|---|---|---|
Texas | 20,851,820 | +21 | 25,145,561 | +18 | 29,677,668 | +18 | 34,894,452 |
Harris County | 3,400,578 | +20 | 4,092,459 | +22 | 4,978,845 | +19 | 5,924,750 |
Total Working Age Population:
Total Households:
Total Working Age Population:
Total Households:
Total Working Age Population:
Total Households: