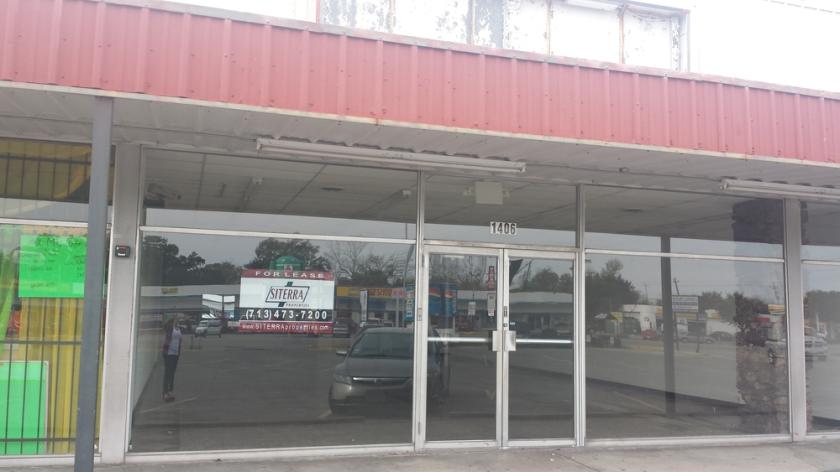
Retail Space
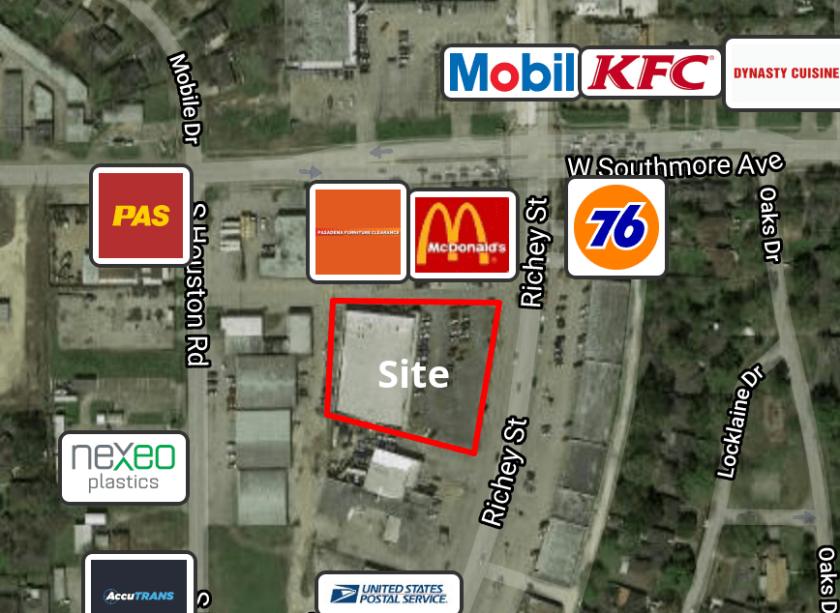
1406 Richey Street Pasadena, TX 77502
1406 Richey Street Pasadena, TX 77502
Details & Description
Property Highlights
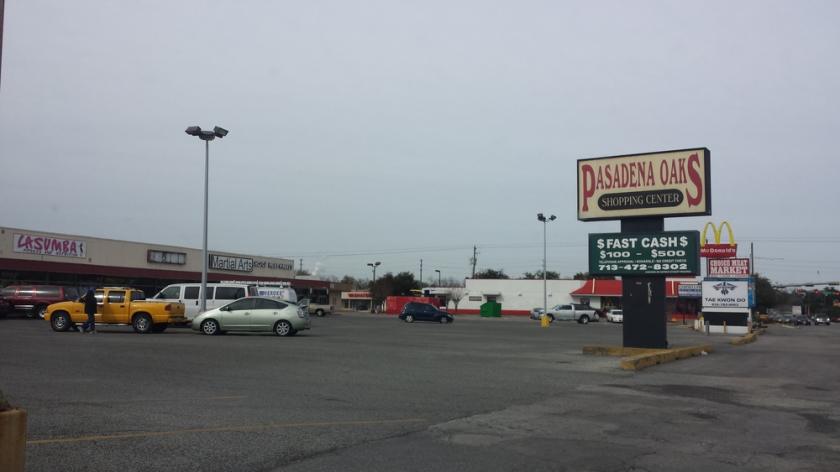
- • Ample parking on 20,000 SF paved area
- • Less than 1.5 Miles From 225
- • Situated in Harris County & Pasadena ISD
Listing Agents

Joel English
O: 713-473-7200
joel@texascres.com
O: 713-473-7200
joel@texascres.com
While we strive to provide the most accurate information, all listing information, and demographic data, is provided by third-parties. As such, MyEListing will not be responsible for the accuracy of the information. It is strongly recommended that you verify all information with the listing agent, and any relevant agencies, prior to making any decisions.