Commercial Land
12410 Knigge Cemetery Road Cypress, TX 77429
12410 Knigge Cemetery Road Cypress, TX 77429
Details & Description
Property Highlights
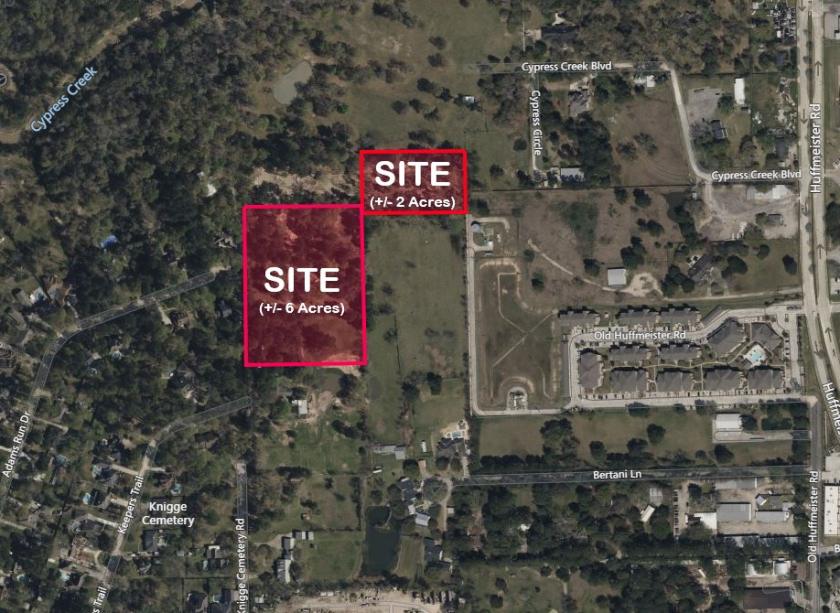
• Located less than half a mile west of Huffmeister Road and only half a mile north of Cypress North Houston Road
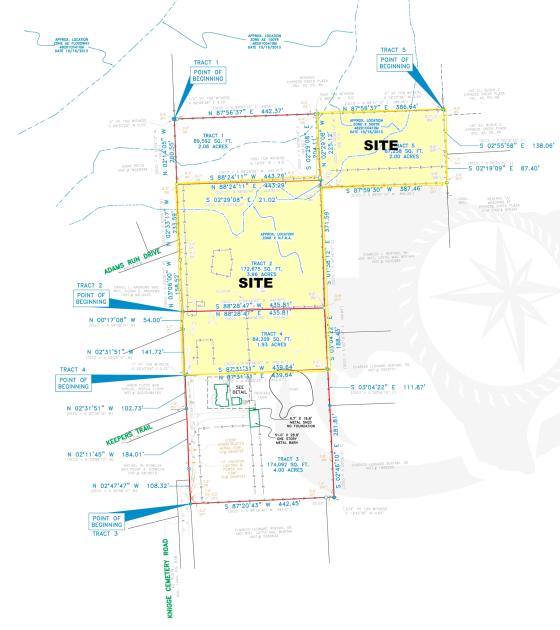
• 8 acres of undeveloped land at the end of Knigge Cemetery Road, just north of Cypress North Houston Road
Listing Agents

Joel English
O: 713-473-7200
joel@texascres.com
O: 713-473-7200
joel@texascres.com

Doug Larson
O: 713-473-7200
M: 713-824-3799
doug@texascres.com
O: 713-473-7200
M: 713-824-3799
doug@texascres.com

Chris Joyce
O: 713-473-7200
M: 936-577-0836
chris@texascres.com
O: 713-473-7200
M: 936-577-0836
chris@texascres.com
While we strive to provide the most accurate information, all listing information, and demographic data, is provided by third-parties. As such, MyEListing will not be responsible for the accuracy of the information. It is strongly recommended that you verify all information with the listing agent, and any relevant agencies, prior to making any decisions.