Office Space
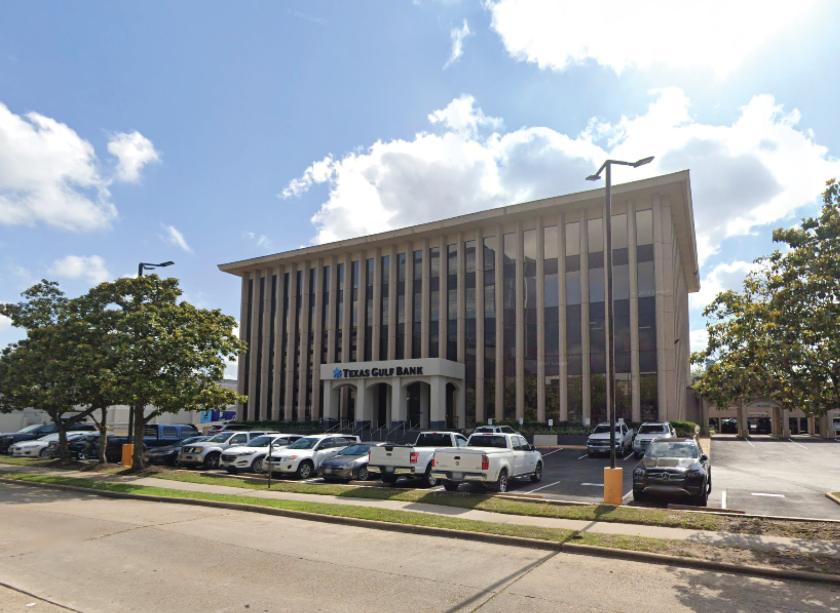
900 Town Country Lane Houston, TX 77024
900 Town Country Lane Houston, TX 77024
Details & Description
Property Highlights
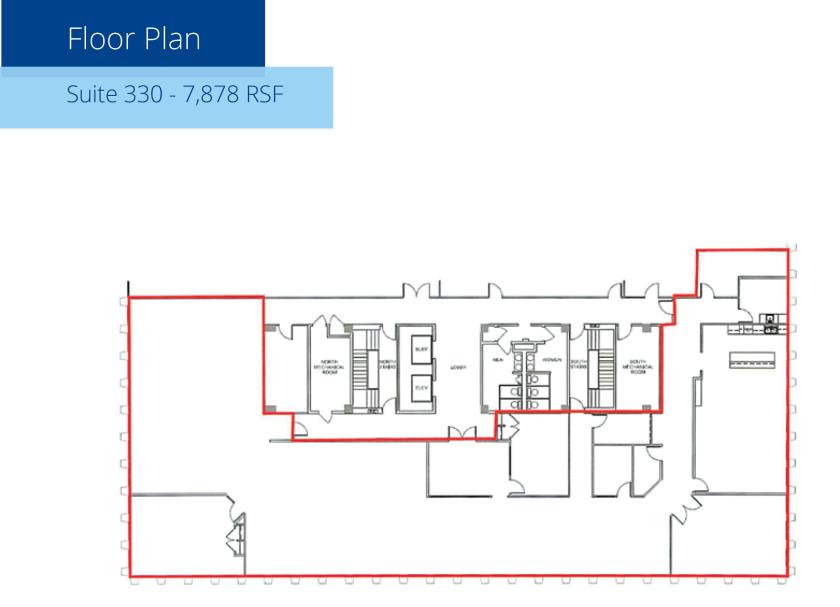
- • Size: 7,878 rsf on the 3rd floor, suite 330
- • Sublease term through 10/31/28
- • Available: 30 days from Landlord’s consent
- • Rental Rate: Contact broker
- • Furniture: Available
- • 3.5/1,000 SF parking ratio
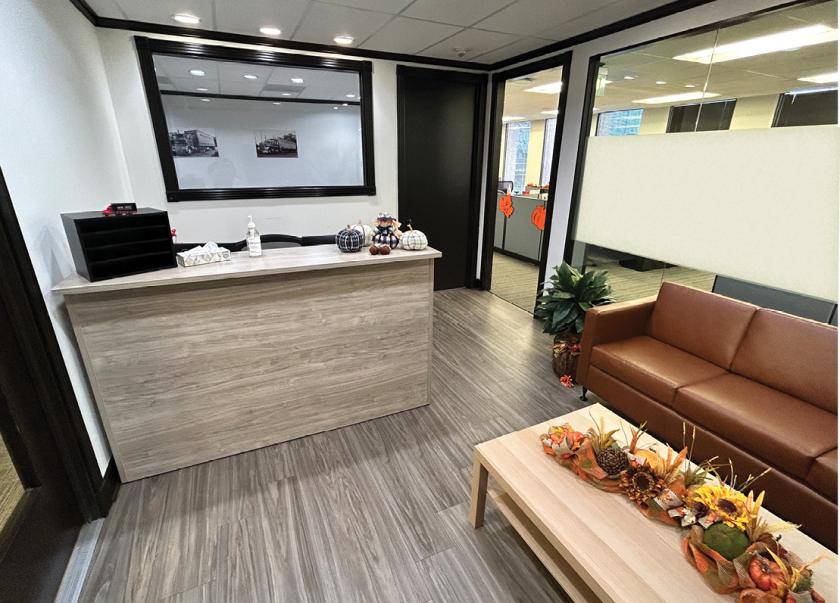
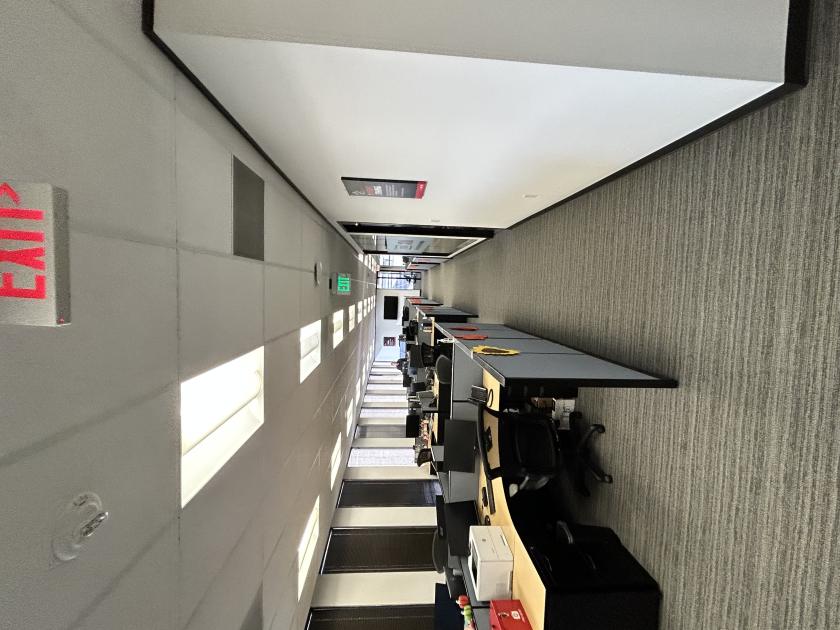
Additional Photos


Listing Agents

Roy Sweeney
O: 713-882-6905
M: 713-882-6905
roy.sweeney@colliers.com
O: 713-882-6905
M: 713-882-6905
roy.sweeney@colliers.com
While we strive to provide the most accurate information, all listing information, and demographic data, is provided by third-parties. As such, MyEListing will not be responsible for the accuracy of the information. It is strongly recommended that you verify all information with the listing agent, and any relevant agencies, prior to making any decisions.