Office Space
1801 East 6th Street Austin, TX 78702
1801 East 6th Street Austin, TX 78702
Details & Description
Property Highlights
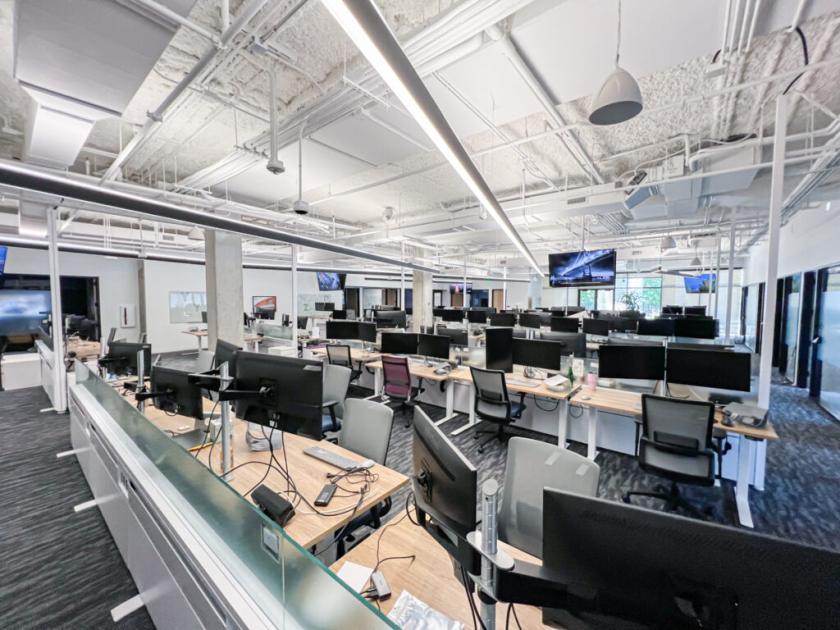
- • Plug & Play Opportunity in East Austin
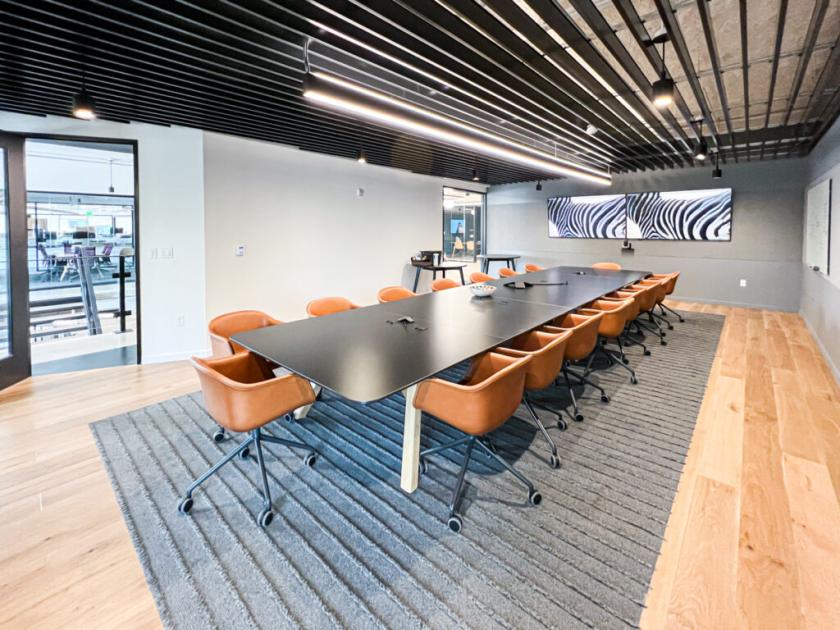
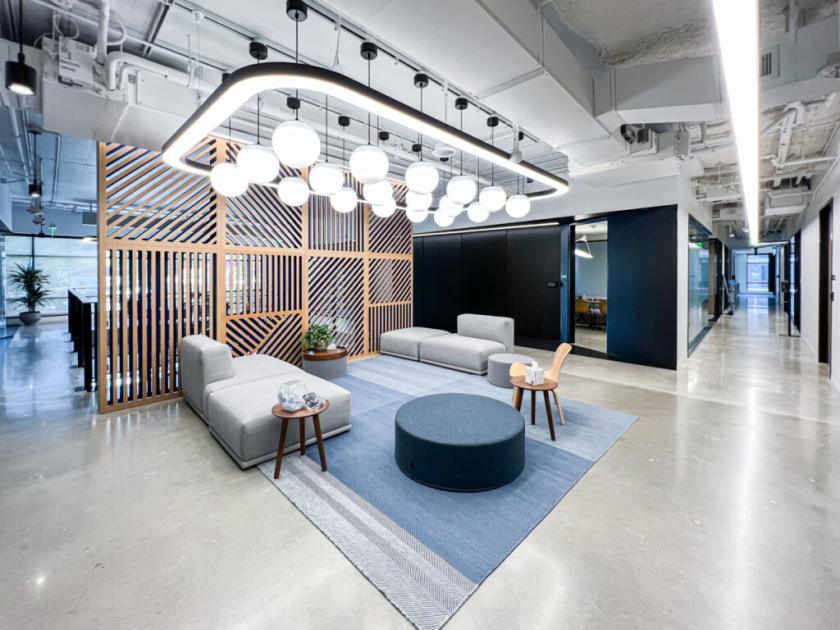
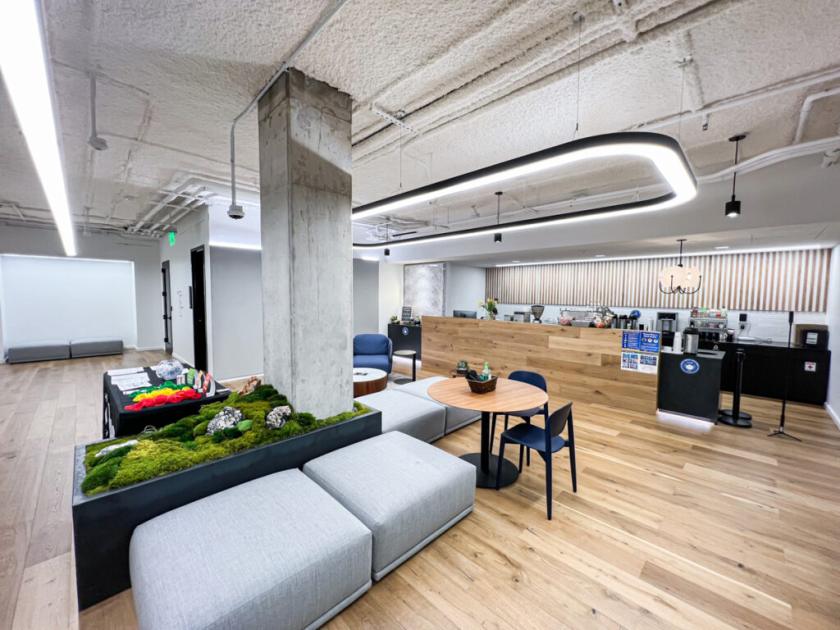
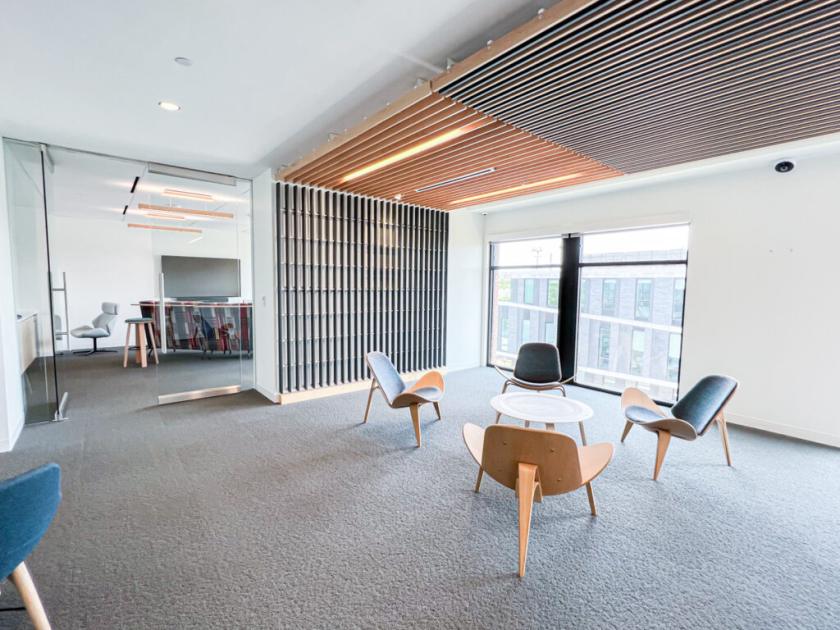
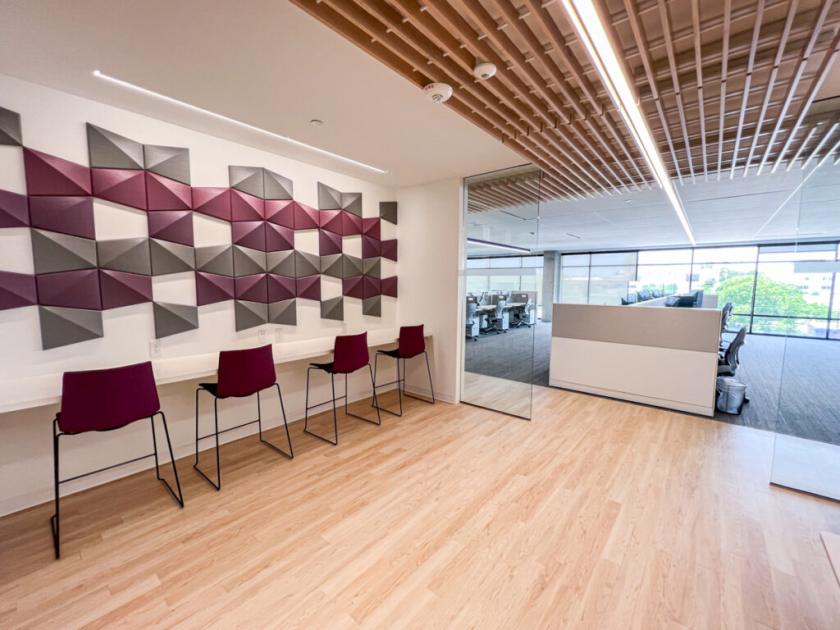
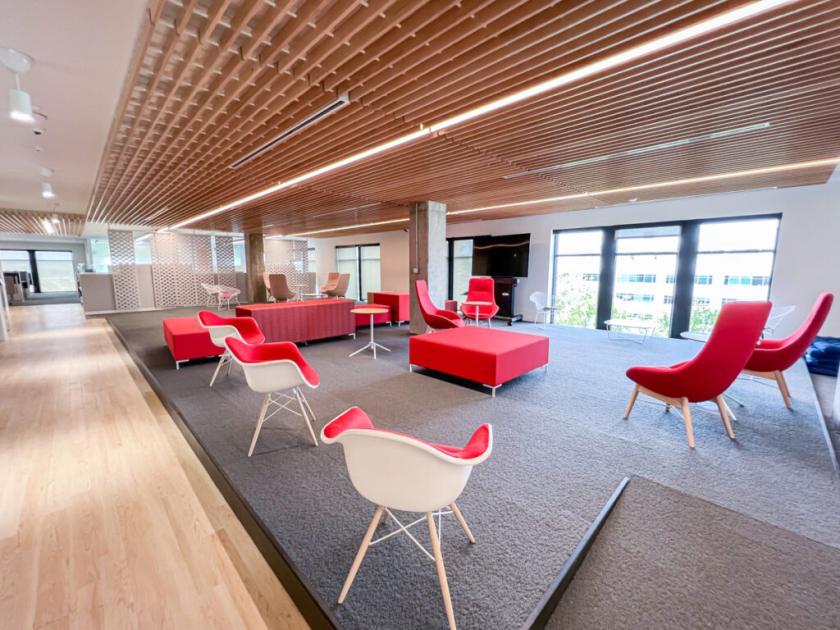
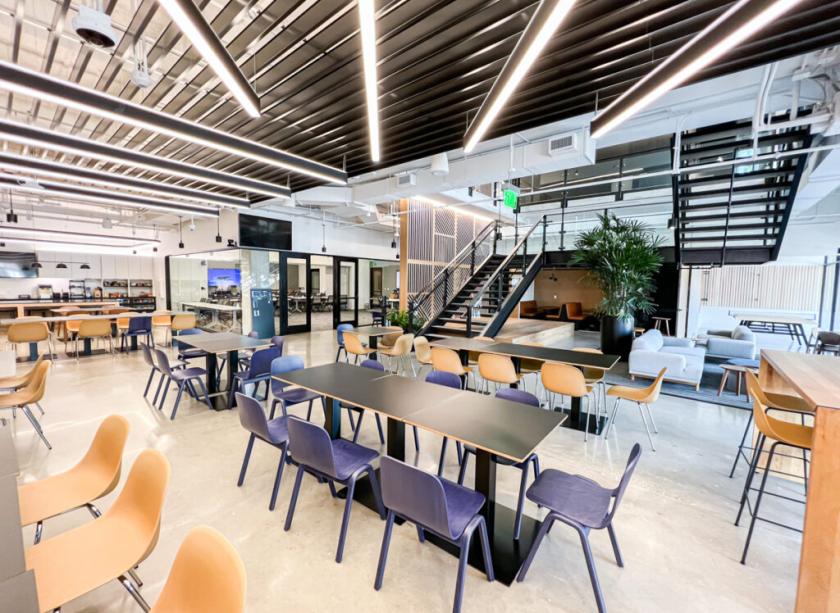
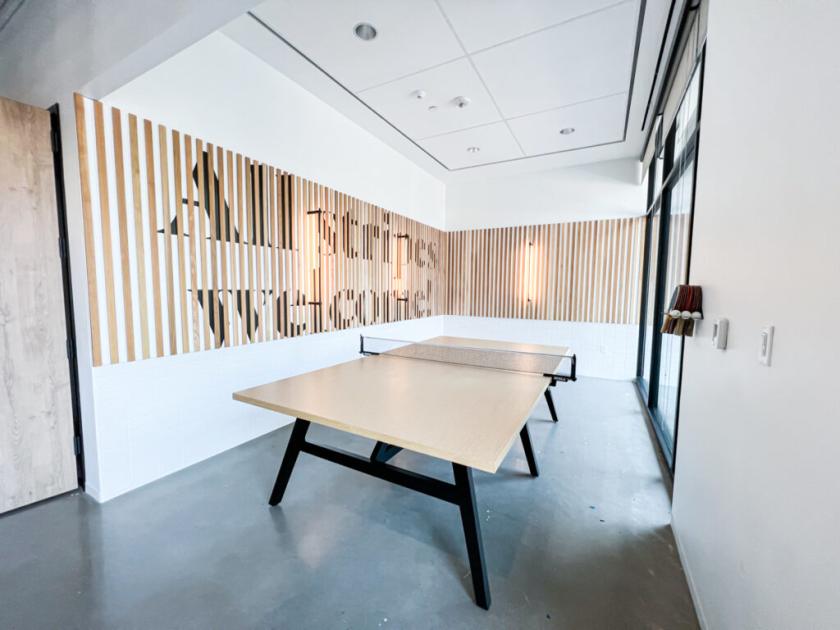
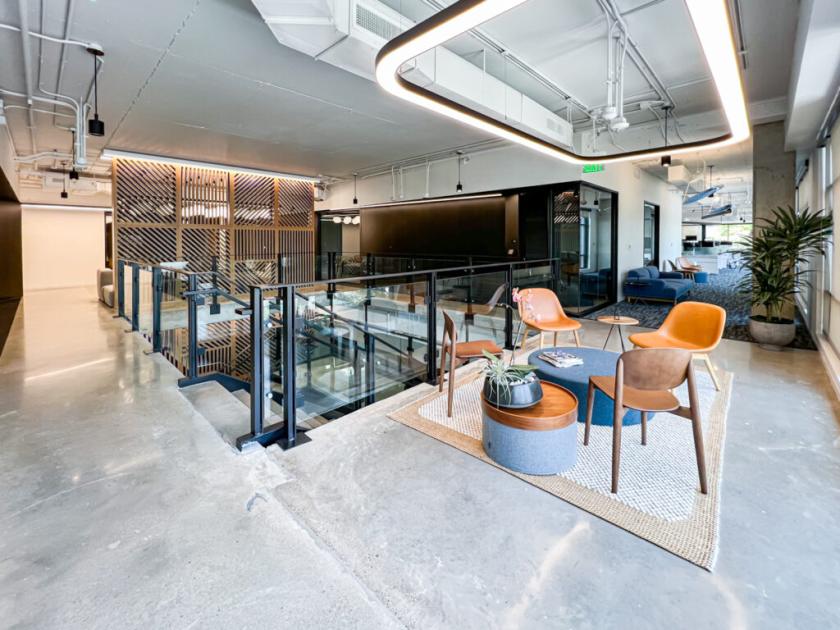
- • Outstanding & fun creative office environment
- • Furniture negotiable
- • Large flexible floorplates
- • Incredible views of Downtown Austin
Additional Photos

Listing Agents

Courtland Lowe
O: 512-538-1033
lowe@hpitx.com
O: 512-538-1033
lowe@hpitx.com
While we strive to provide the most accurate information, all listing information, and demographic data, is provided by third-parties. As such, MyEListing will not be responsible for the accuracy of the information. It is strongly recommended that you verify all information with the listing agent, and any relevant agencies, prior to making any decisions.