Office Space
7940 Shoal Creek Boulevard Austin, TX 78757
7940 Shoal Creek Boulevard Austin, TX 78757
Details & Description
Property Highlights
• Ideal medical space with close proximity to medical district
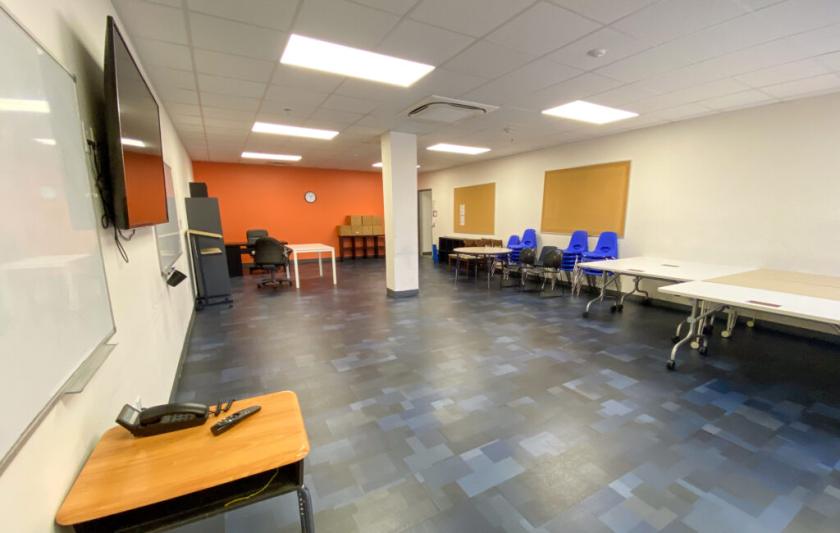
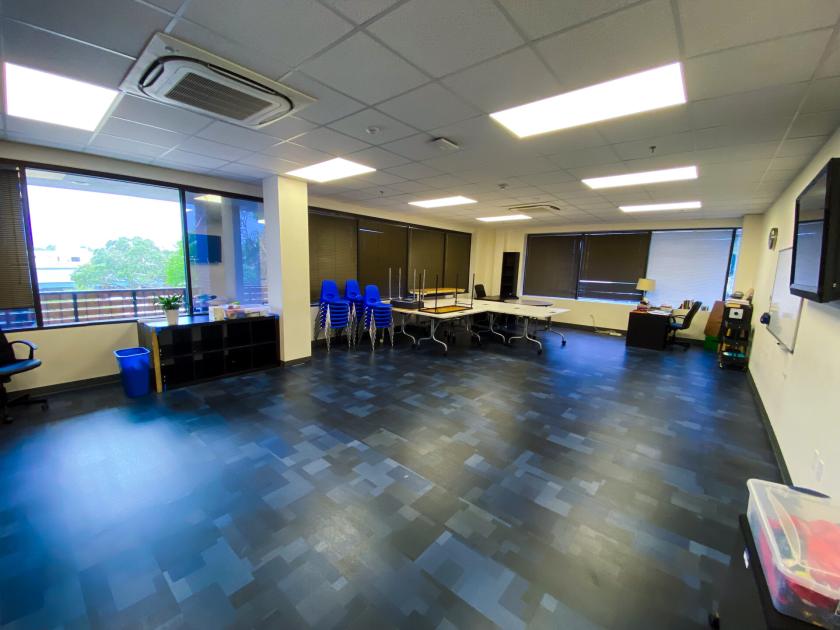
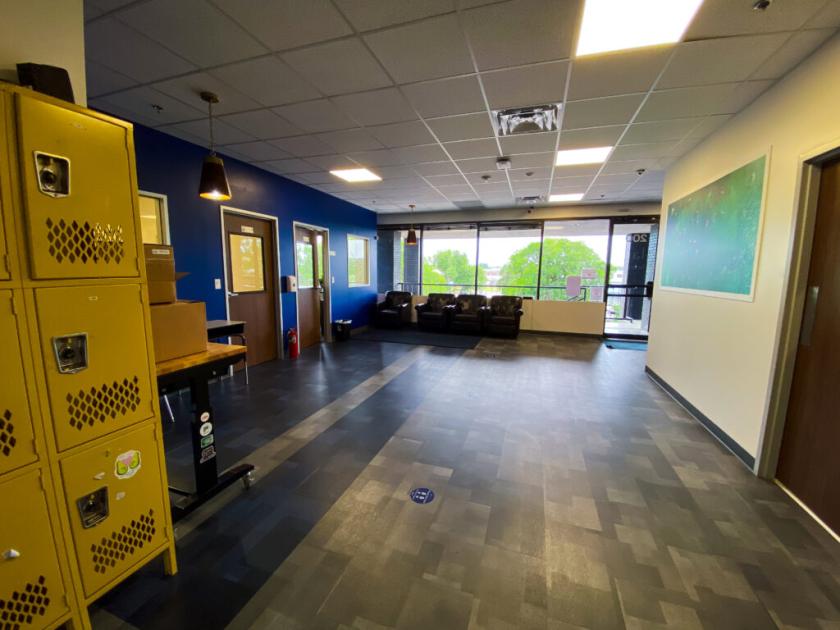
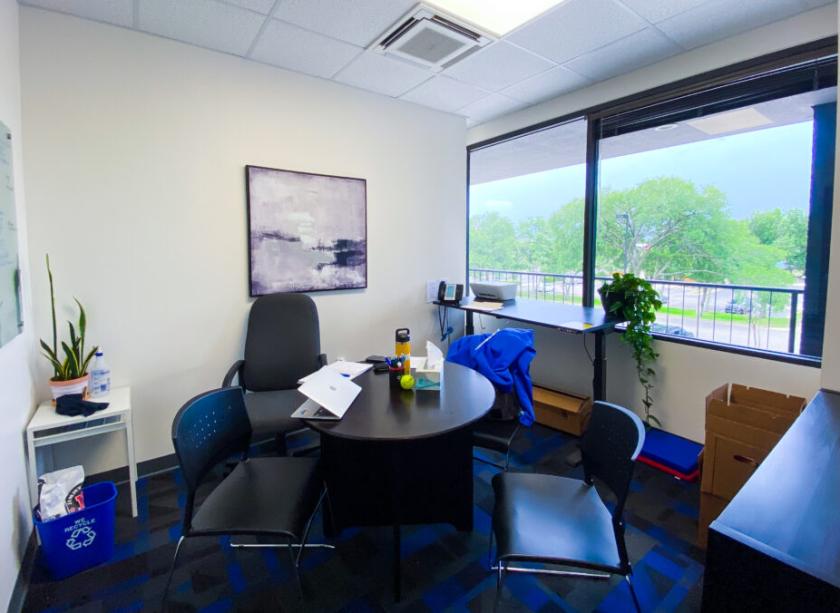
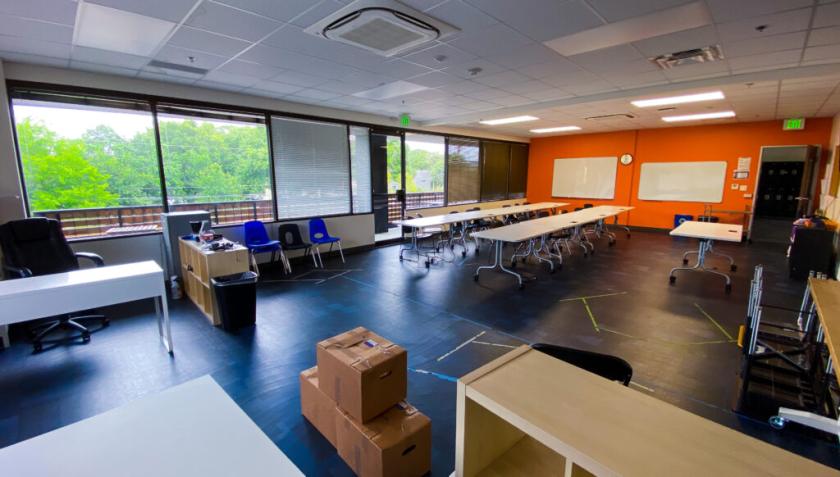
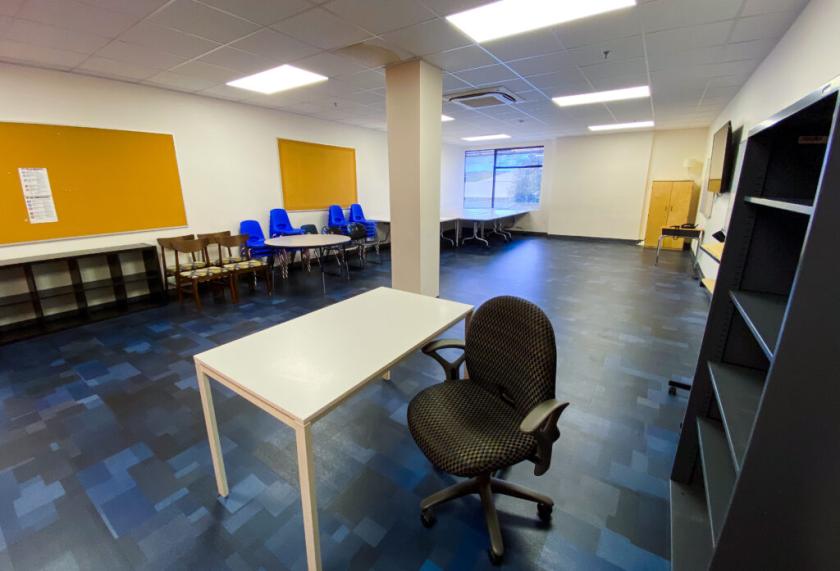
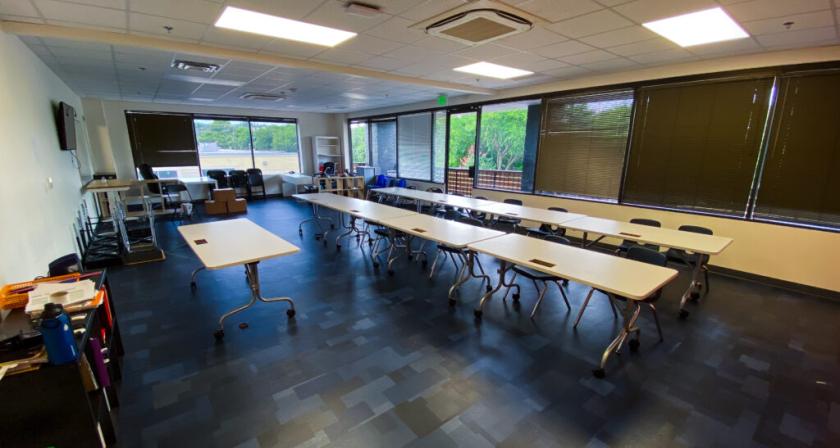
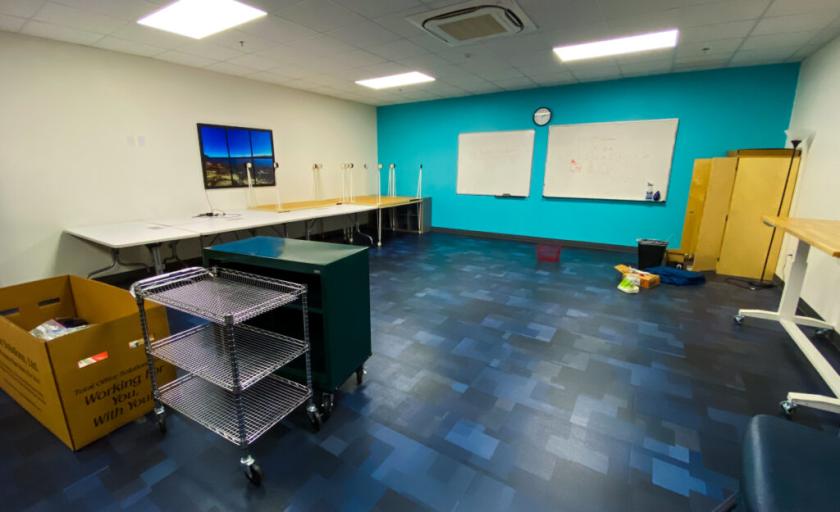
• 7,000 SF move-in ready school space
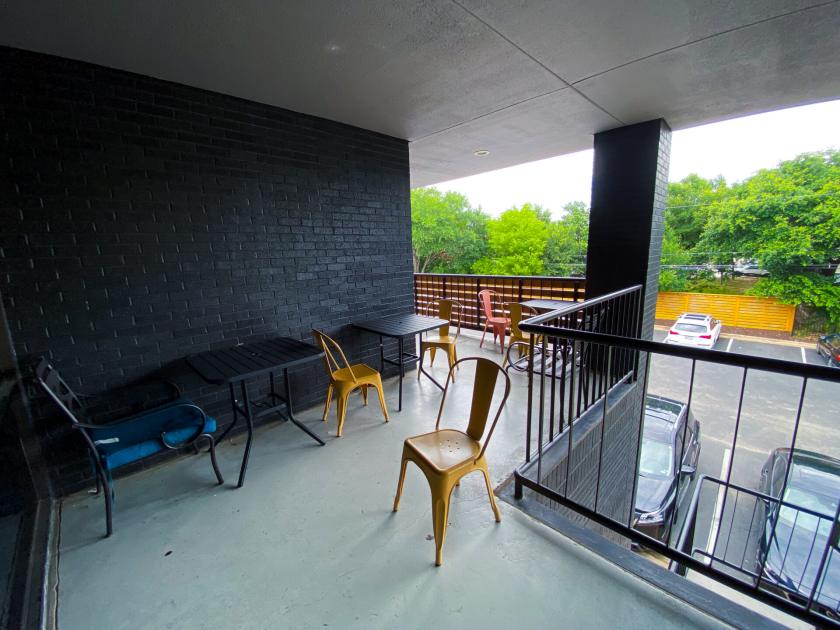
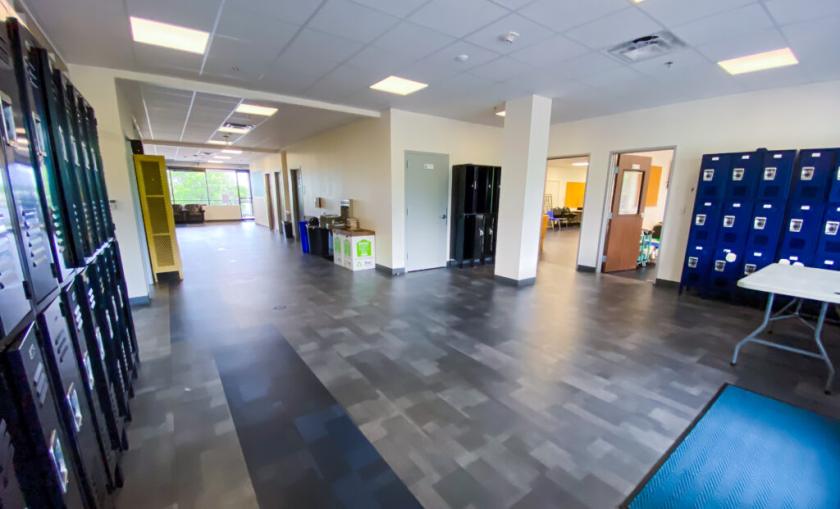
Additional Photos
Listing Agents

Casey Casper
O: 512-835-4455
ccasper@hpitx.com
O: 512-835-4455
ccasper@hpitx.com
While we strive to provide the most accurate information, all listing information, and demographic data, is provided by third-parties. As such, MyEListing will not be responsible for the accuracy of the information. It is strongly recommended that you verify all information with the listing agent, and any relevant agencies, prior to making any decisions.