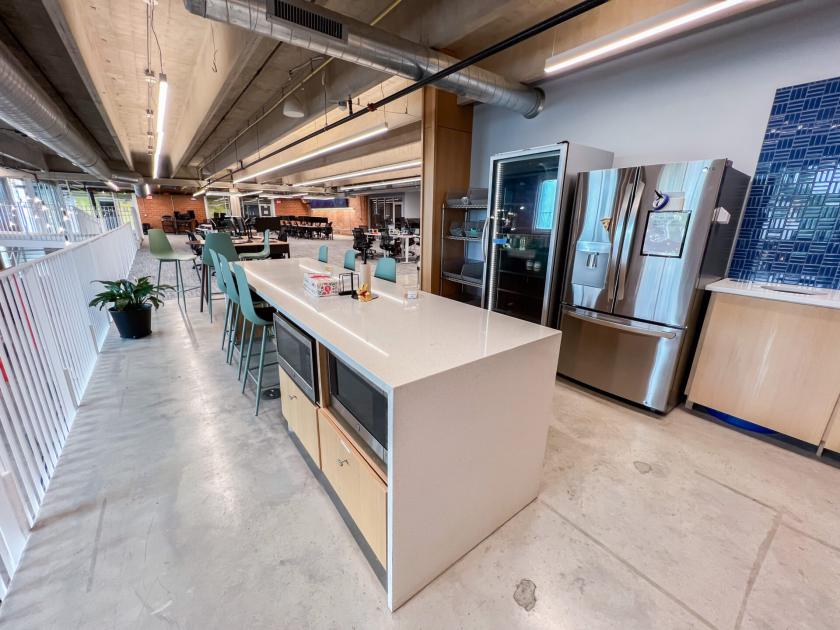
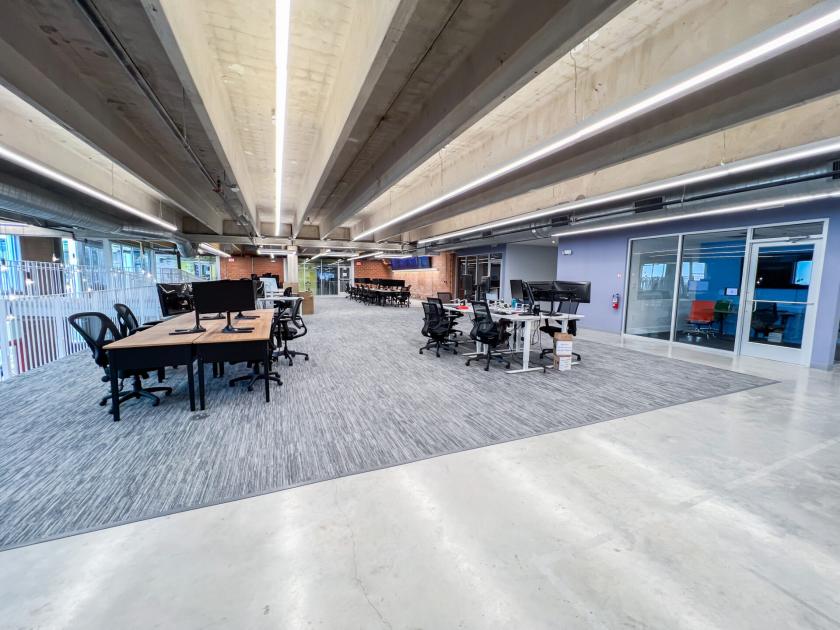
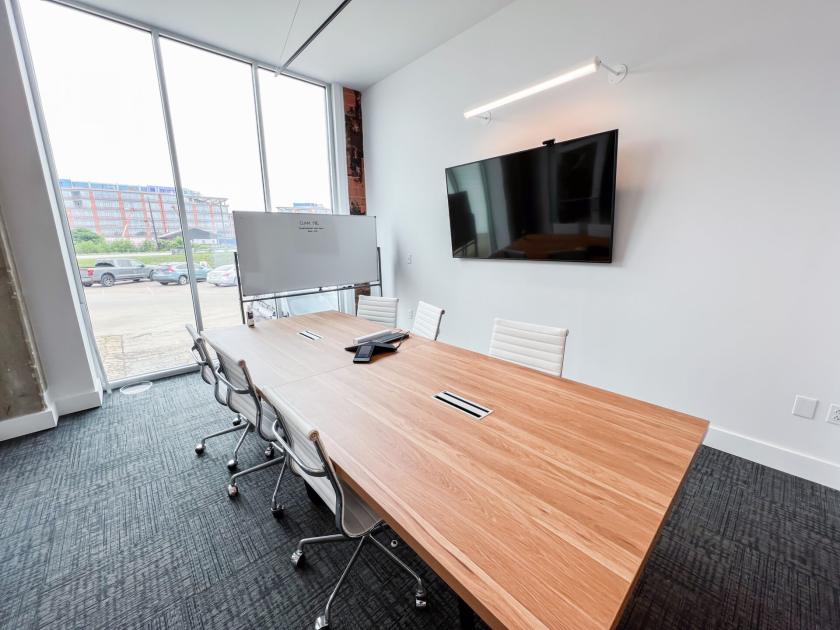
Office Space
979 Springdale Road Austin, TX 78702
979 Springdale Road Austin, TX 78702
Details & Description
Property Highlights
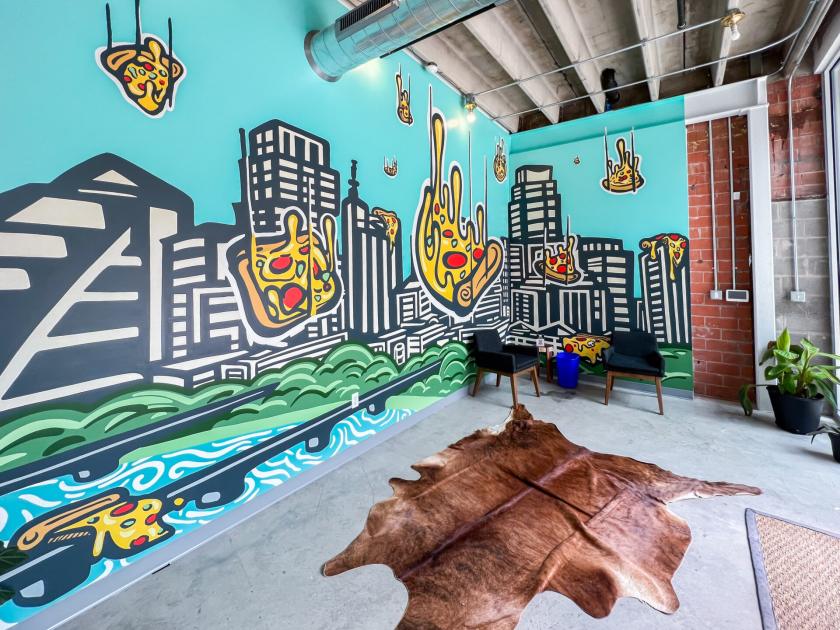
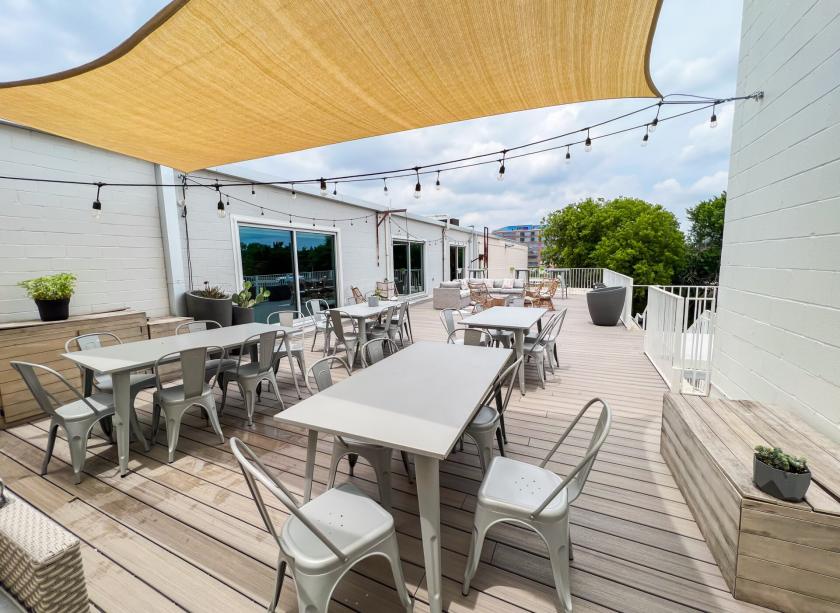
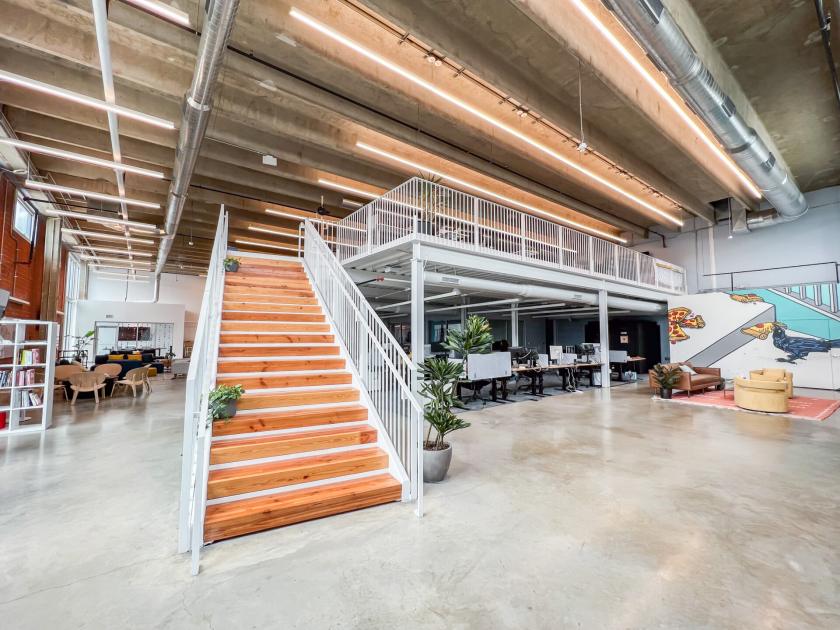
• Large outdoor patio
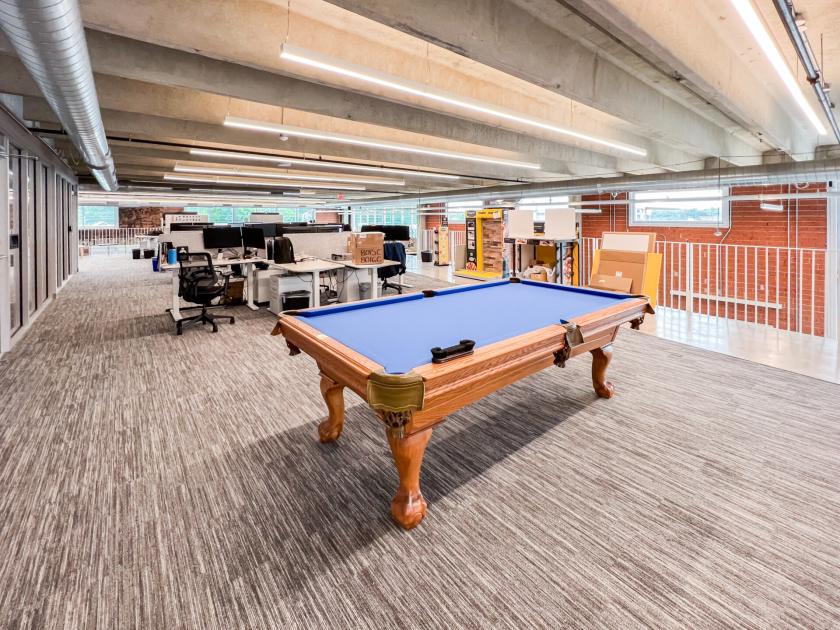
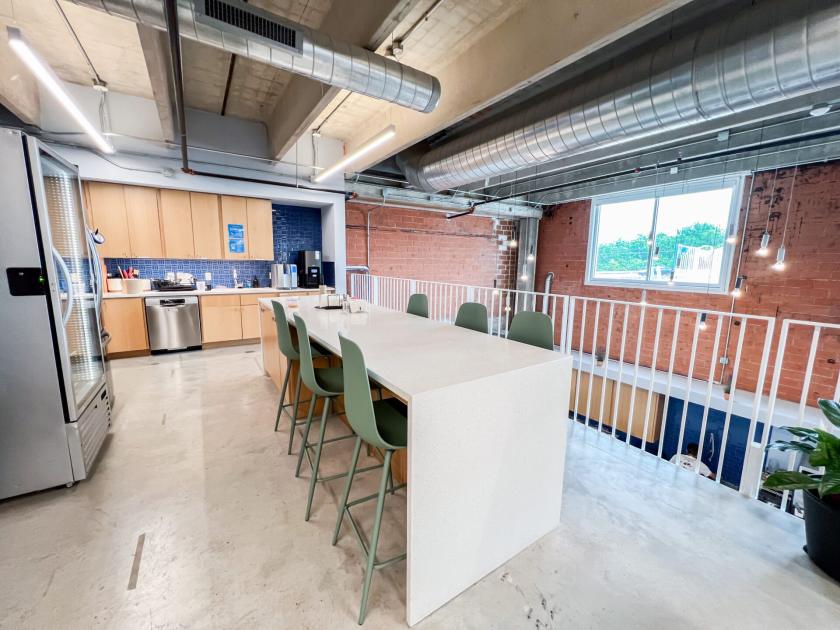
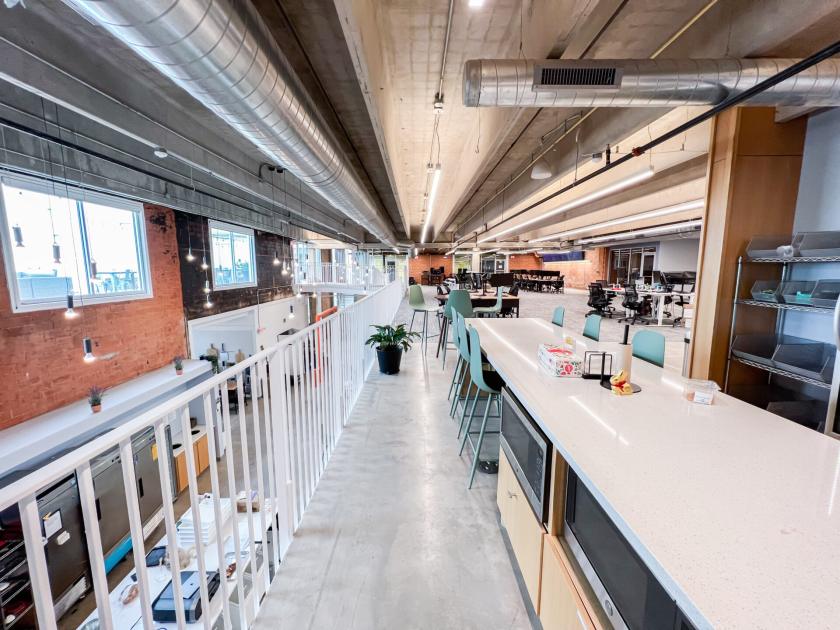
• Furniture included
Additional Photos


Listing Agents

Rick Lange
M: 512-538-2092
rlange@hpitx.com
M: 512-538-2092
rlange@hpitx.com
While we strive to provide the most accurate information, all listing information, and demographic data, is provided by third-parties. As such, MyEListing will not be responsible for the accuracy of the information. It is strongly recommended that you verify all information with the listing agent, and any relevant agencies, prior to making any decisions.