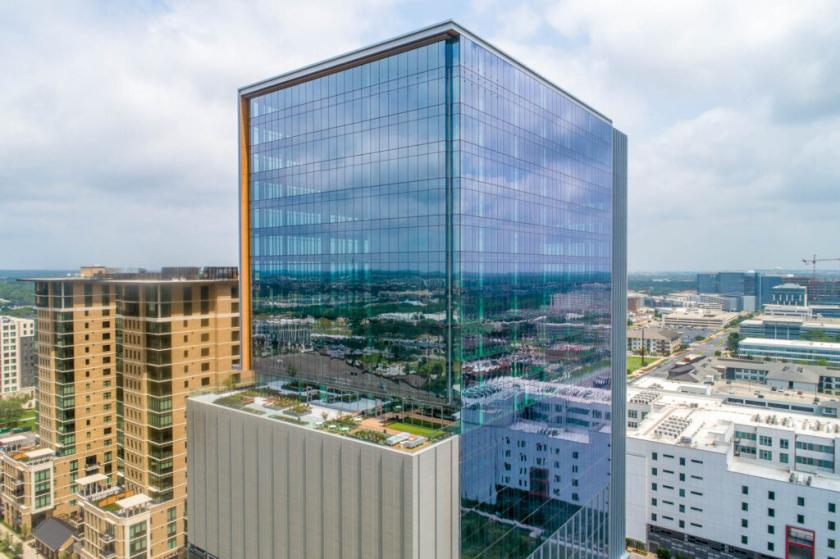
Office Space
10025 Alterra Parkway Austin, TX 78758
10025 Alterra Parkway Austin, TX 78758
Details & Description
Property Highlights
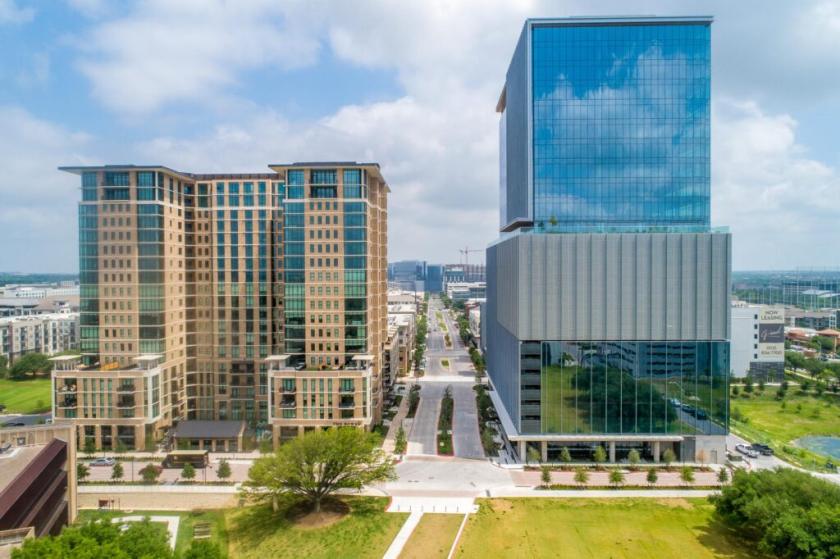
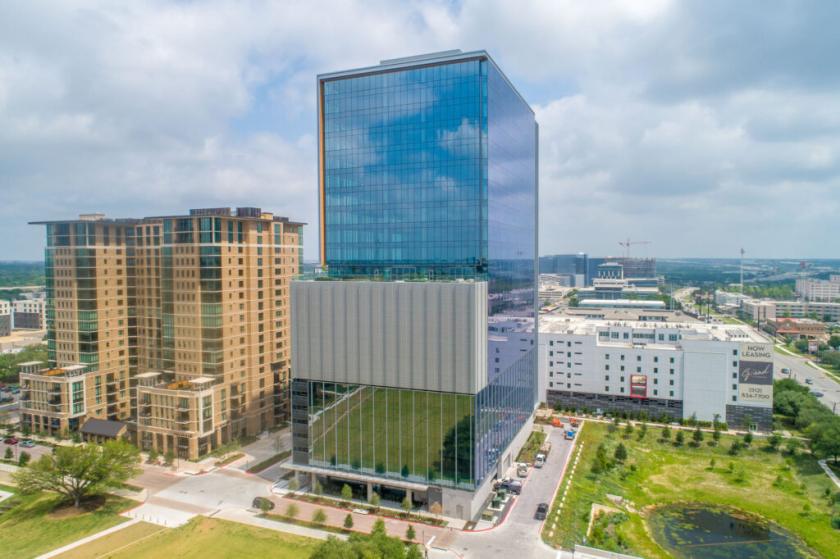
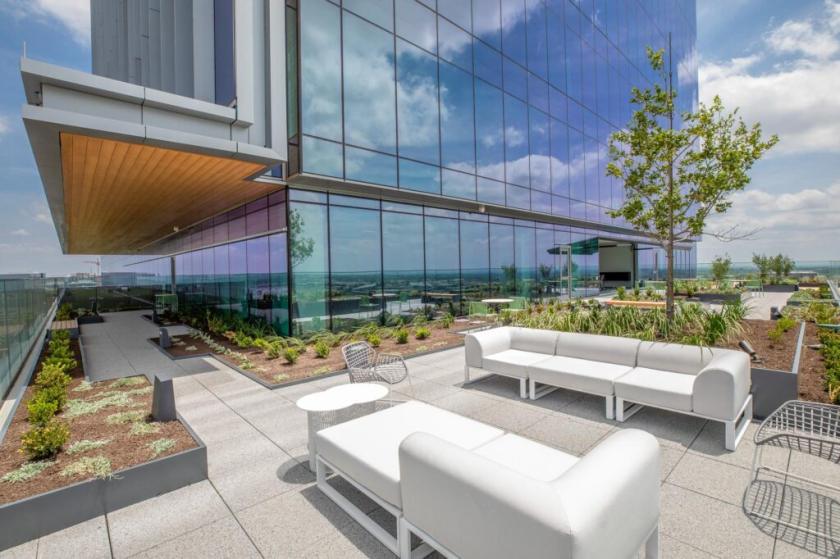
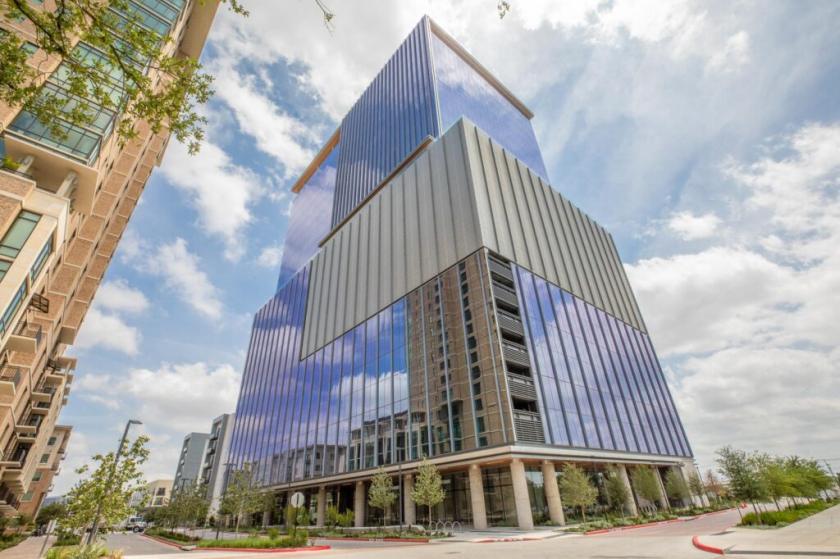
- • Class AA Office Development
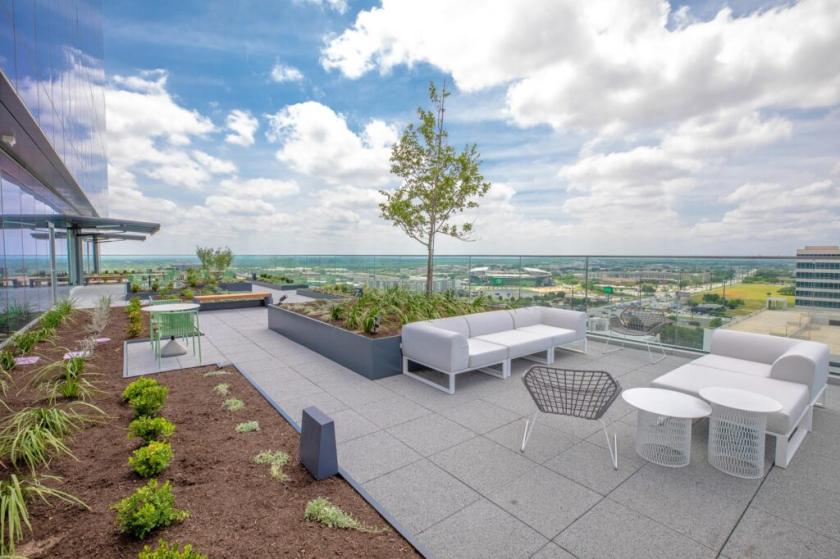
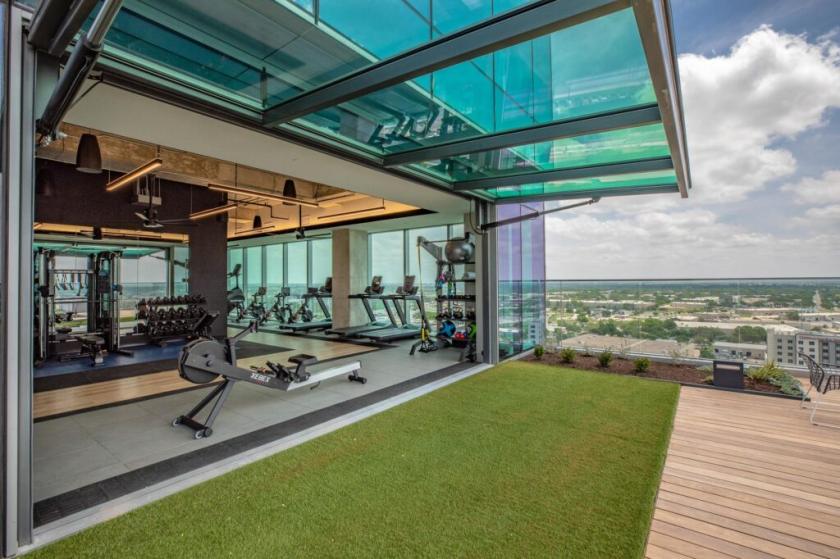
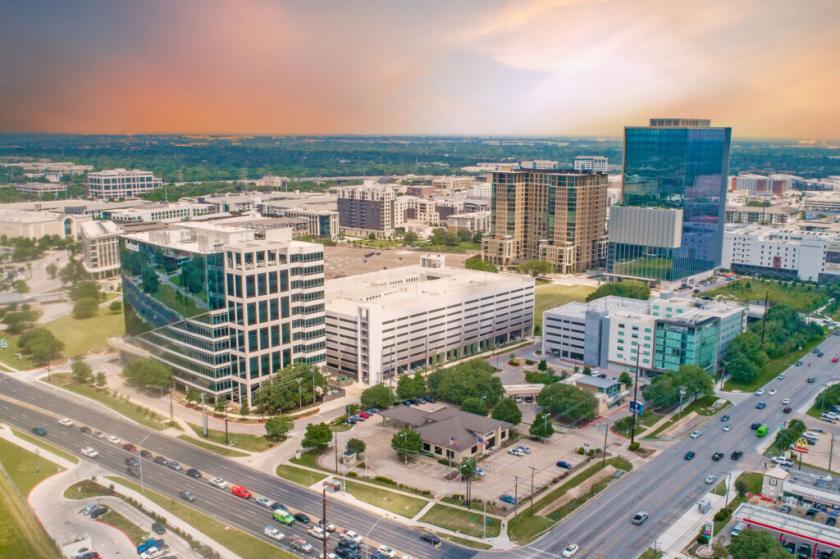
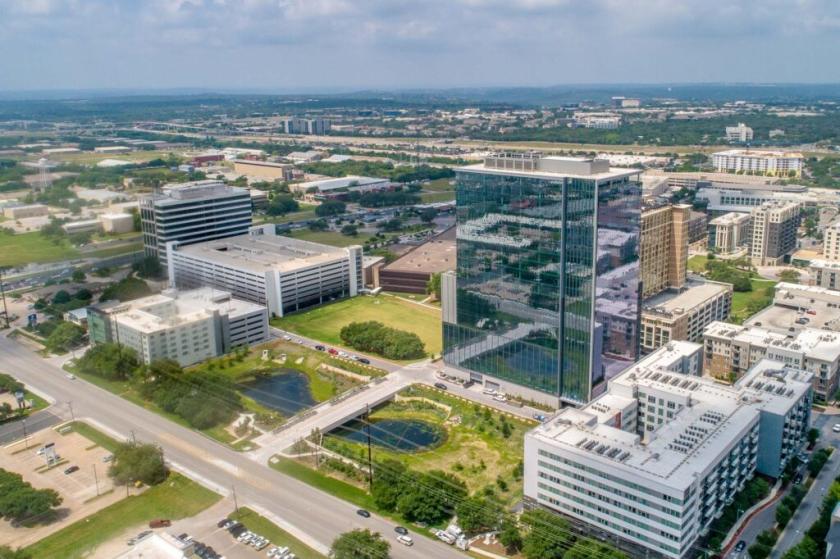
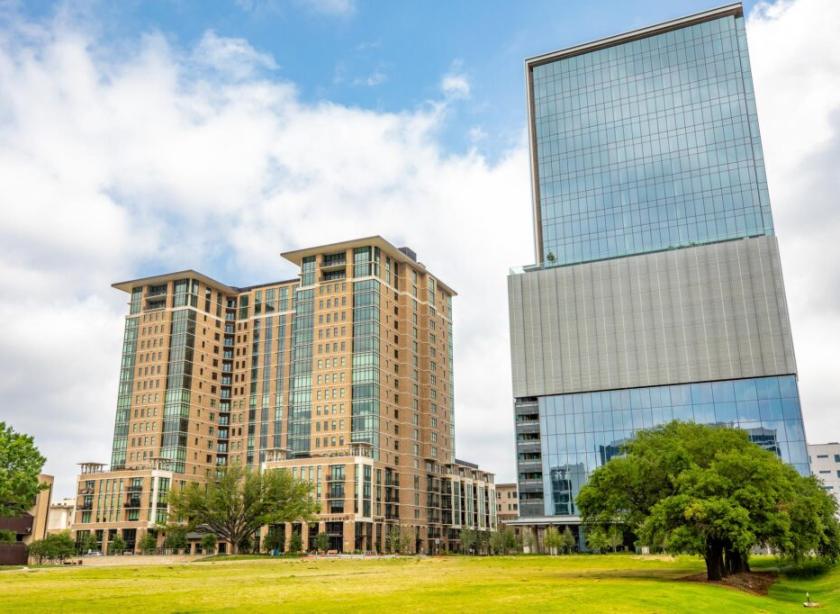
- • Work, Live, Play Community
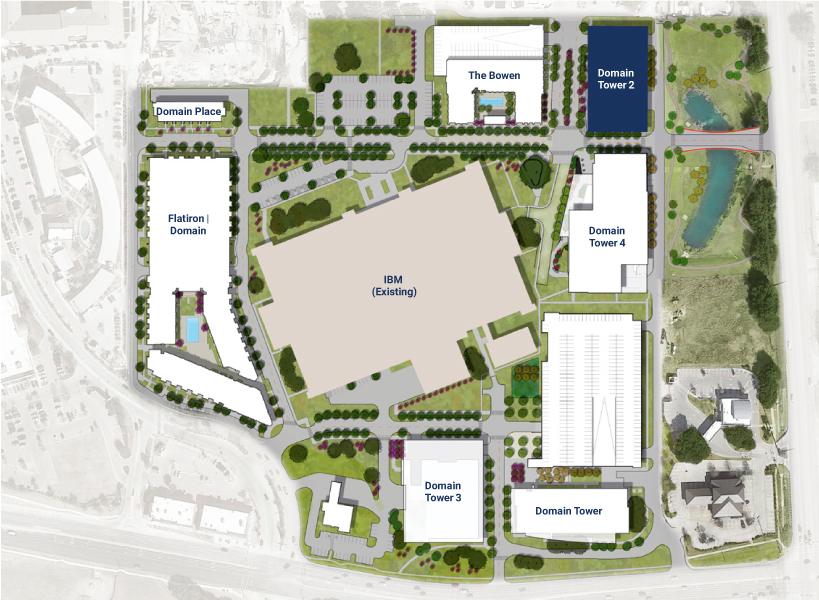
- • Surrounded by Austin’s Major Office Tenants
- • Tall-Exterior Windows
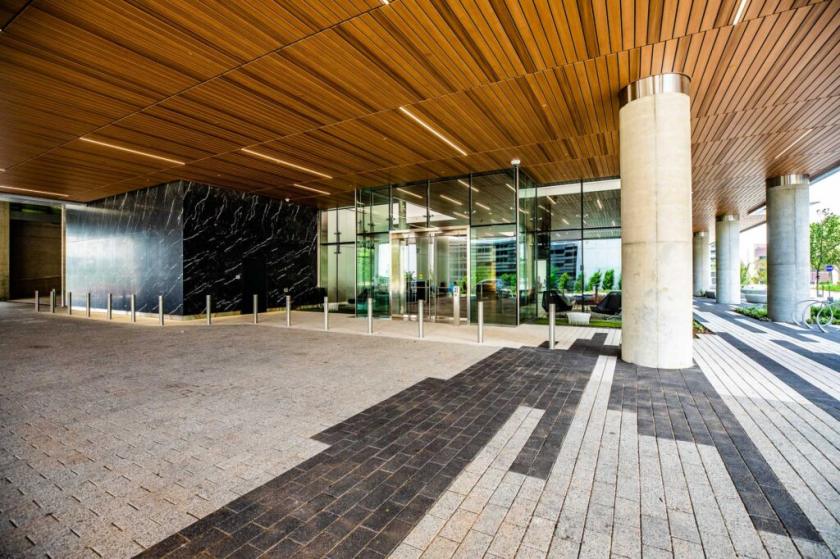
- • Multiple Point of Ingress/Egress
Additional Photos
Listing Agents

Richard Paddock
O: 512-538-0057
paddock@hpitx.com
O: 512-538-0057
paddock@hpitx.com
While we strive to provide the most accurate information, all listing information, and demographic data, is provided by third-parties. As such, MyEListing will not be responsible for the accuracy of the information. It is strongly recommended that you verify all information with the listing agent, and any relevant agencies, prior to making any decisions.