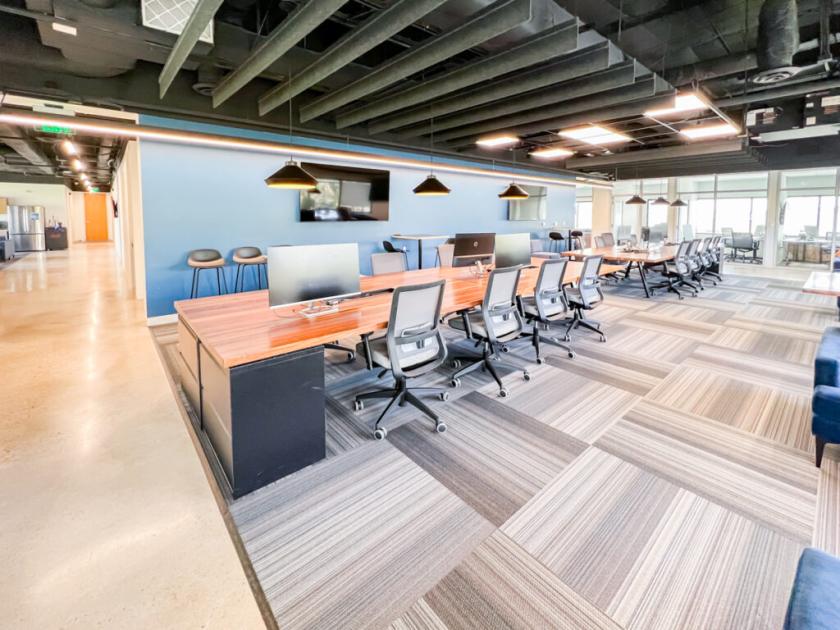
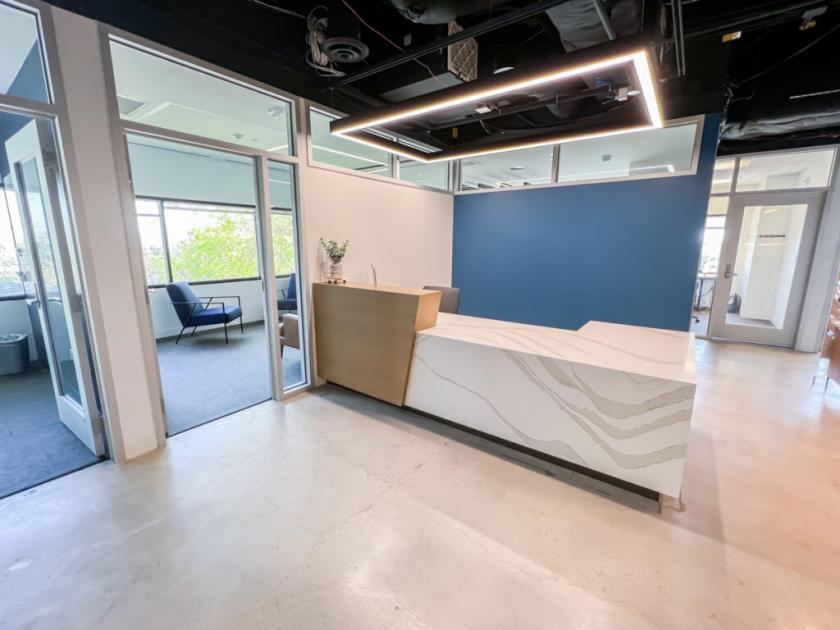
Office Space
916 South Capital of Texas Highway Austin, TX 78746
916 South Capital of Texas Highway Austin, TX 78746

Details & Description
Property Highlights
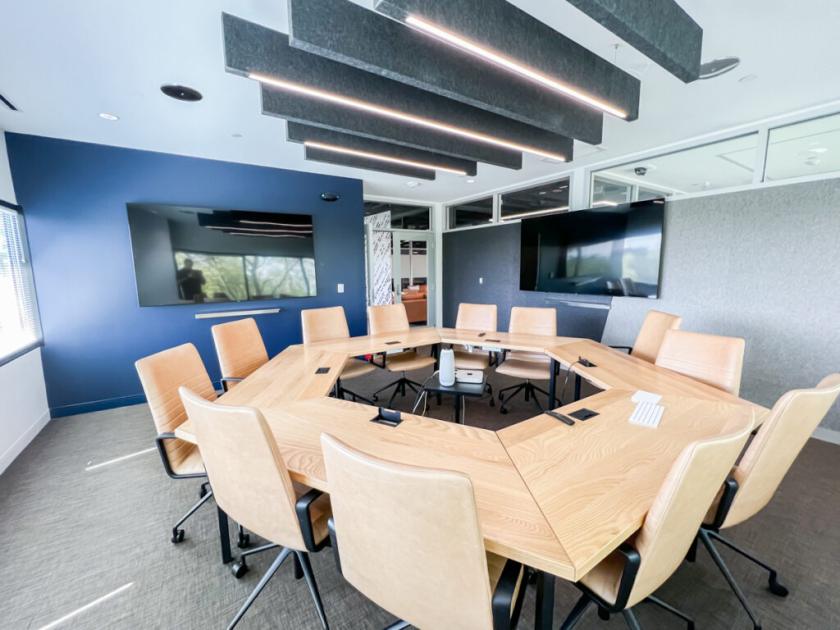
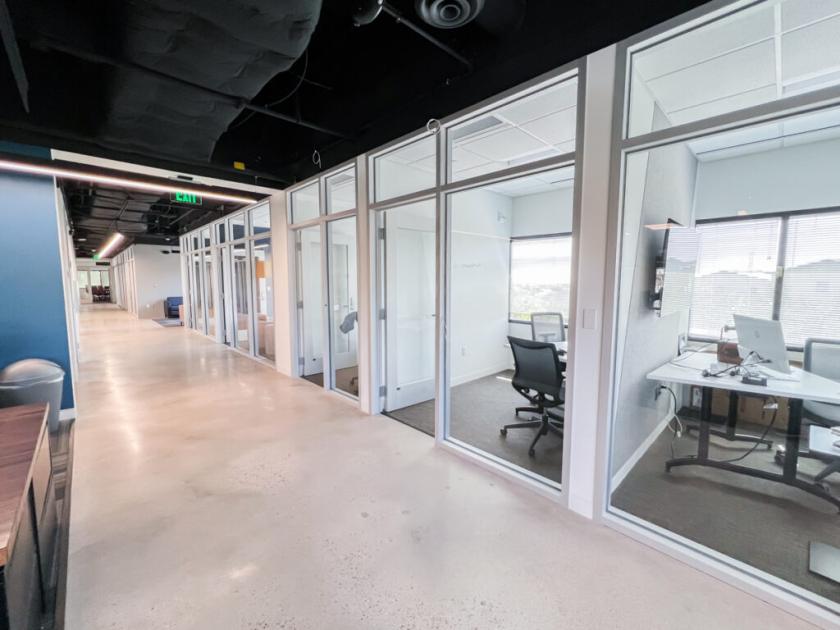
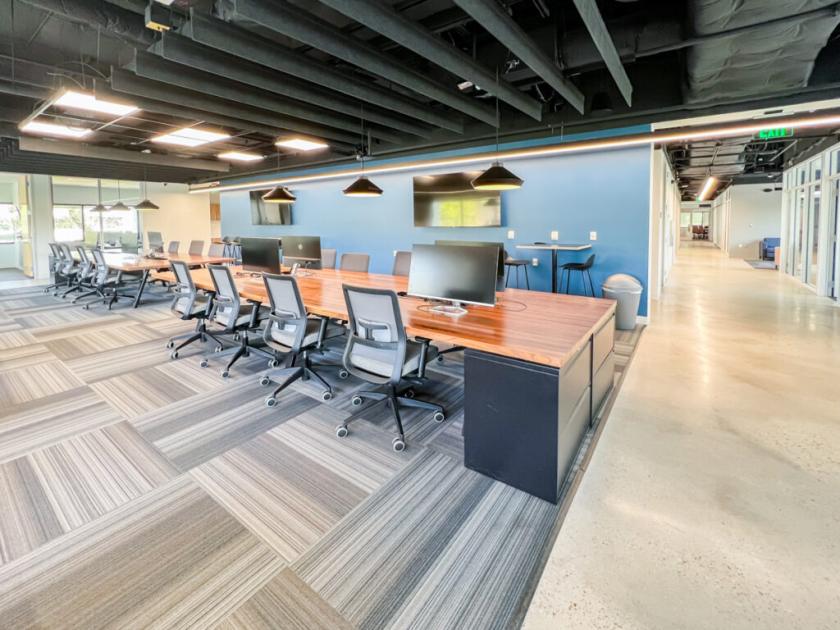
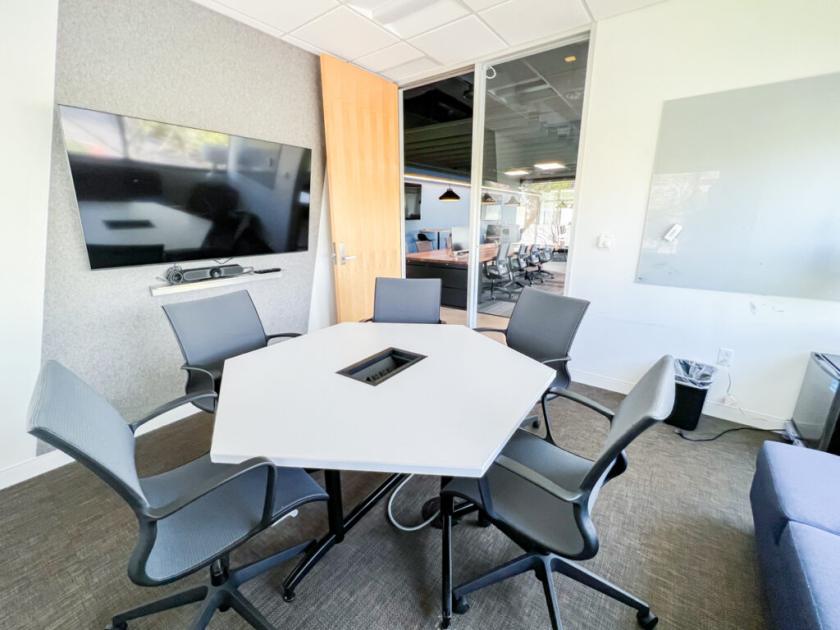
- • 9,436 SF move-in ready sublease
- • Additional space can be made available
- • Flexible sublease term through May 31, 2026
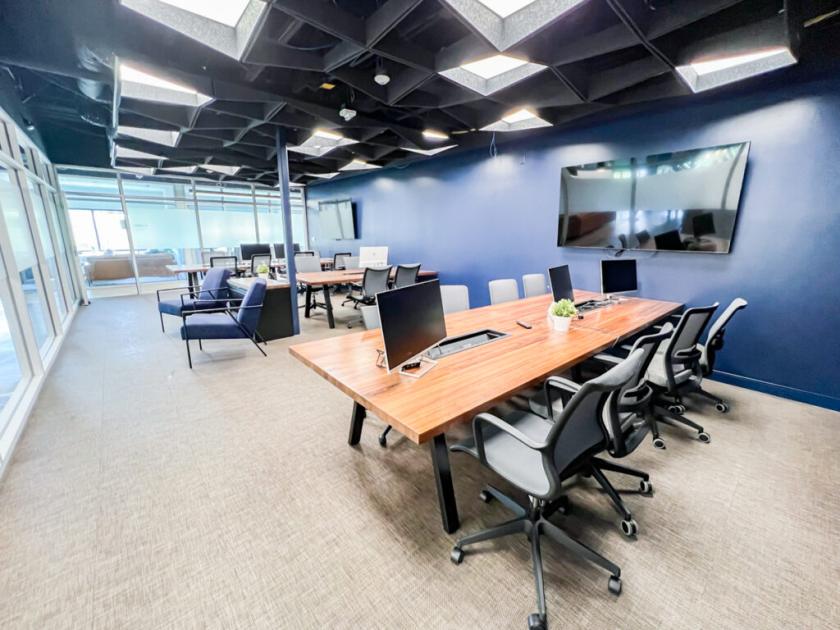
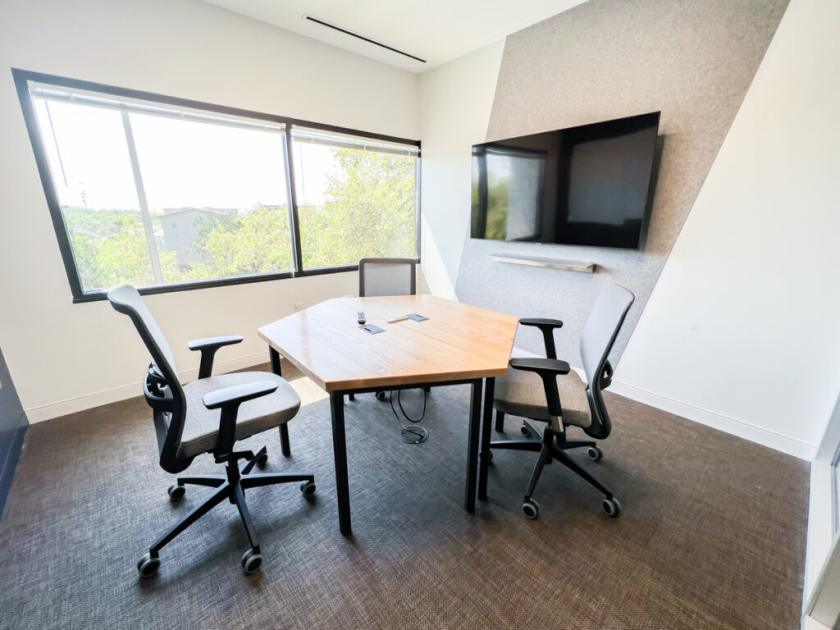
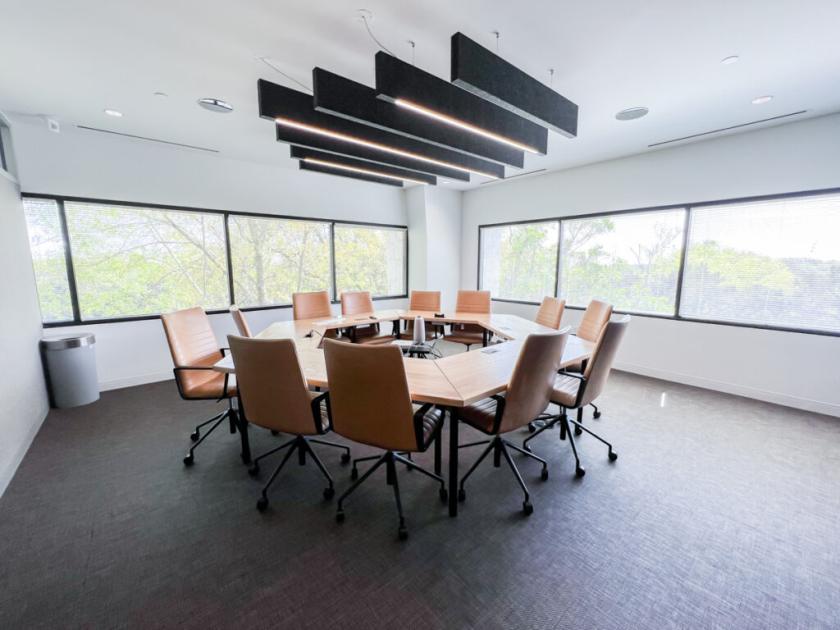
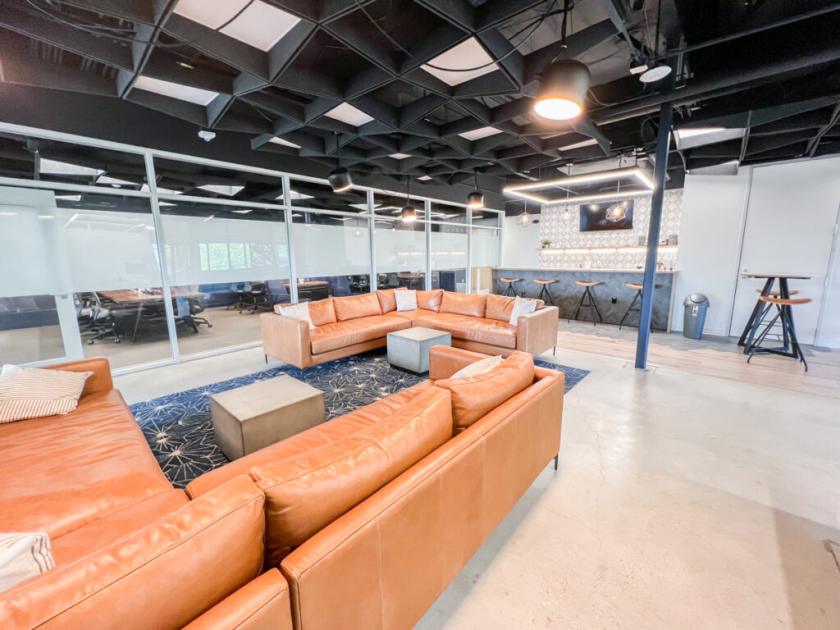
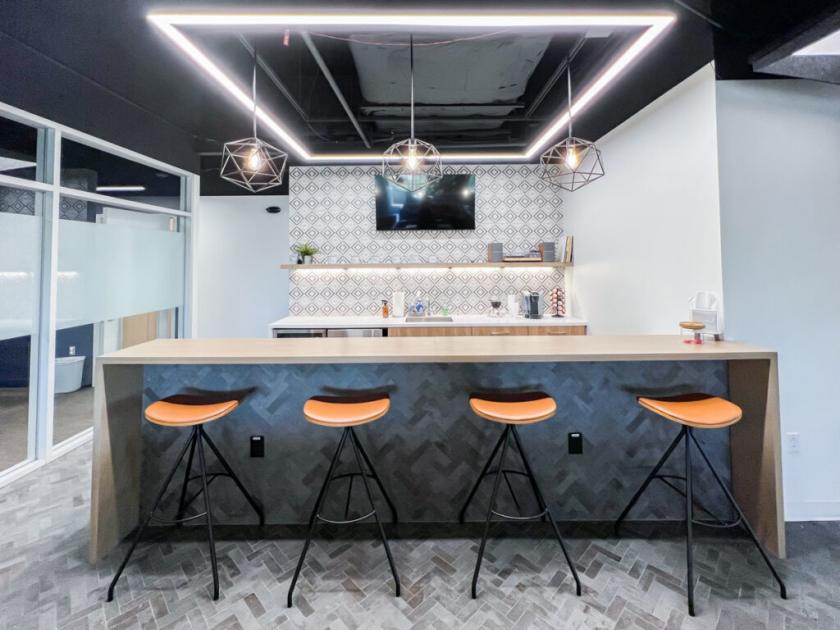
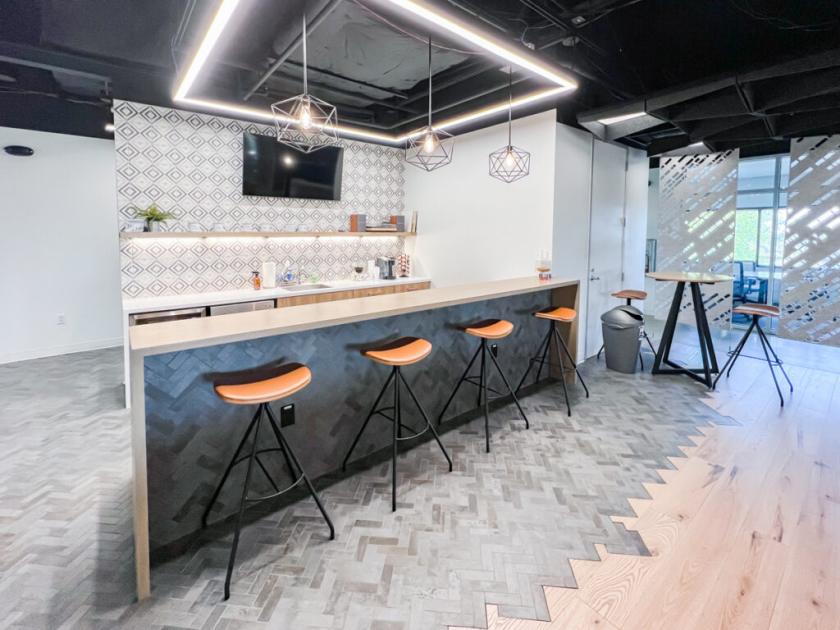
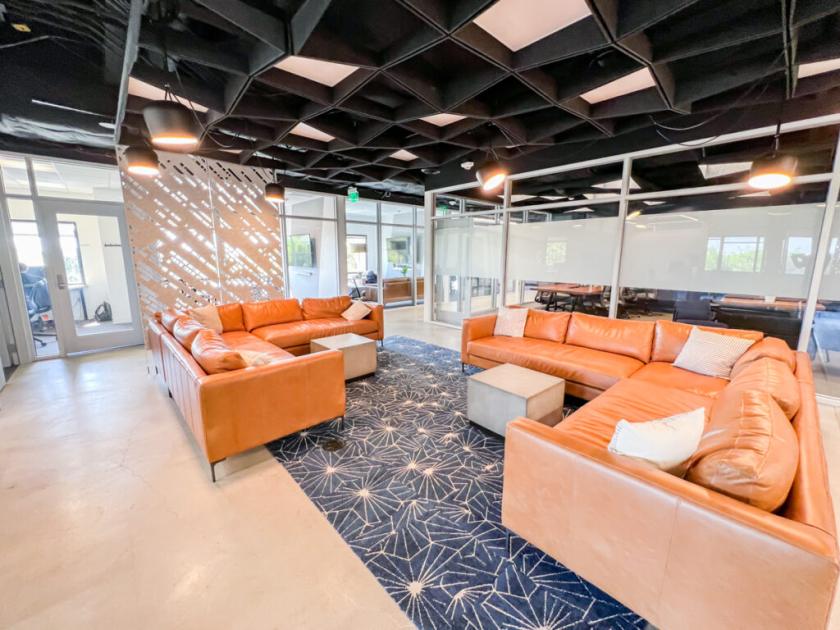
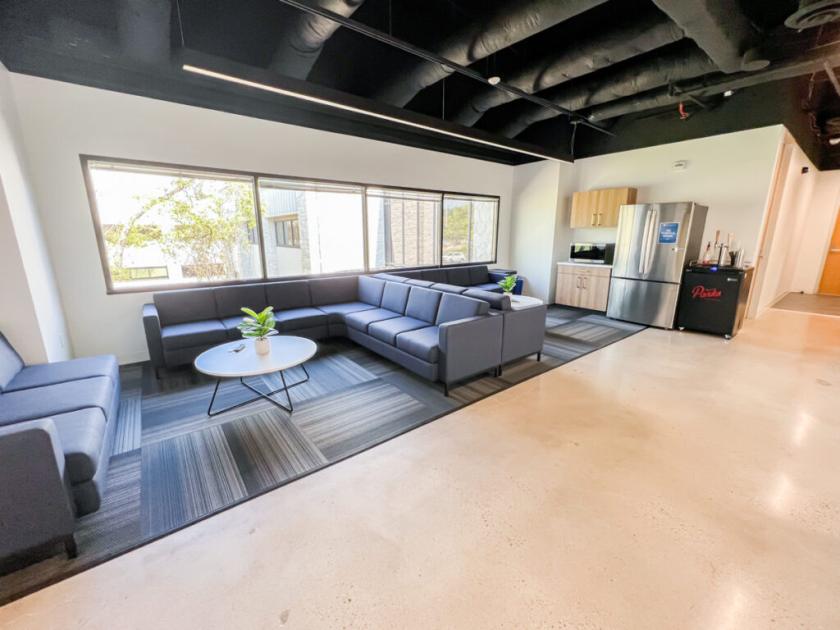
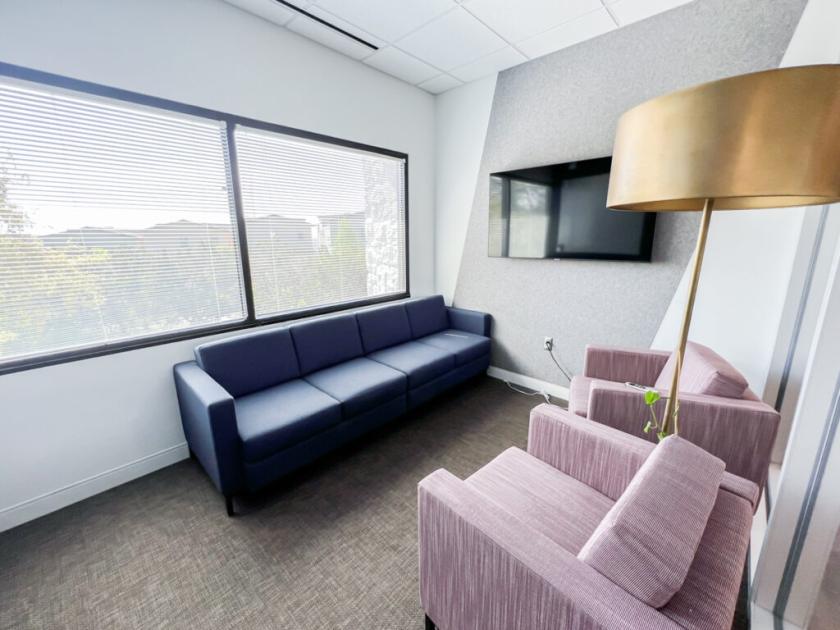
- • Furniture included
Additional Photos
Listing Agents

Michael Waters
M: 512-538-0077
mwaters@hpitx.com
M: 512-538-0077
mwaters@hpitx.com
While we strive to provide the most accurate information, all listing information, and demographic data, is provided by third-parties. As such, MyEListing will not be responsible for the accuracy of the information. It is strongly recommended that you verify all information with the listing agent, and any relevant agencies, prior to making any decisions.