Office Space
4009 Marathon Boulevard Austin, TX 78756
4009 Marathon Boulevard Austin, TX 78756
Details & Description
Property Highlights
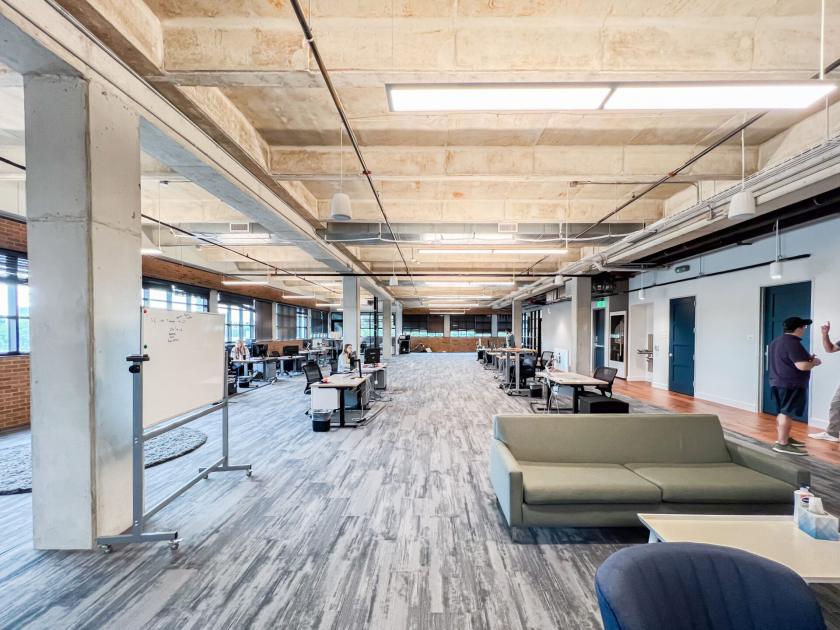
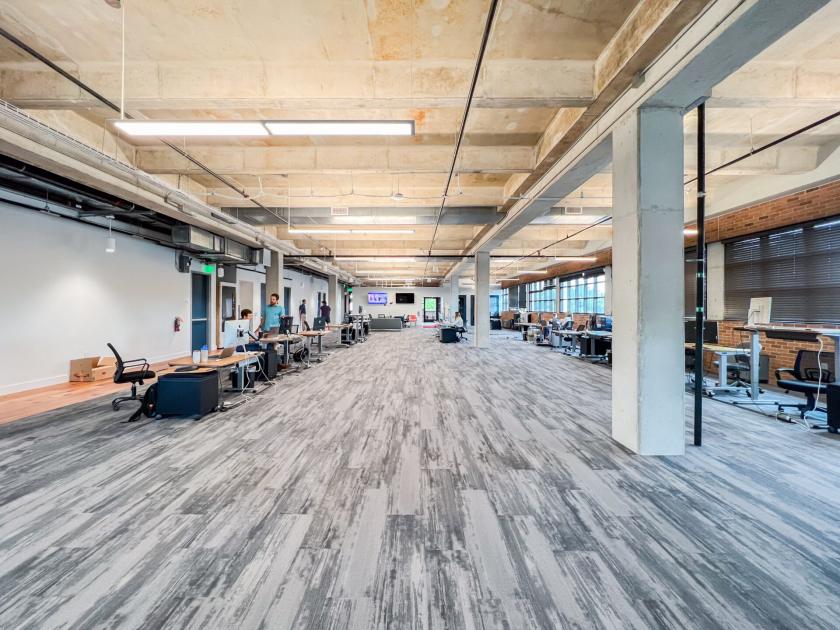
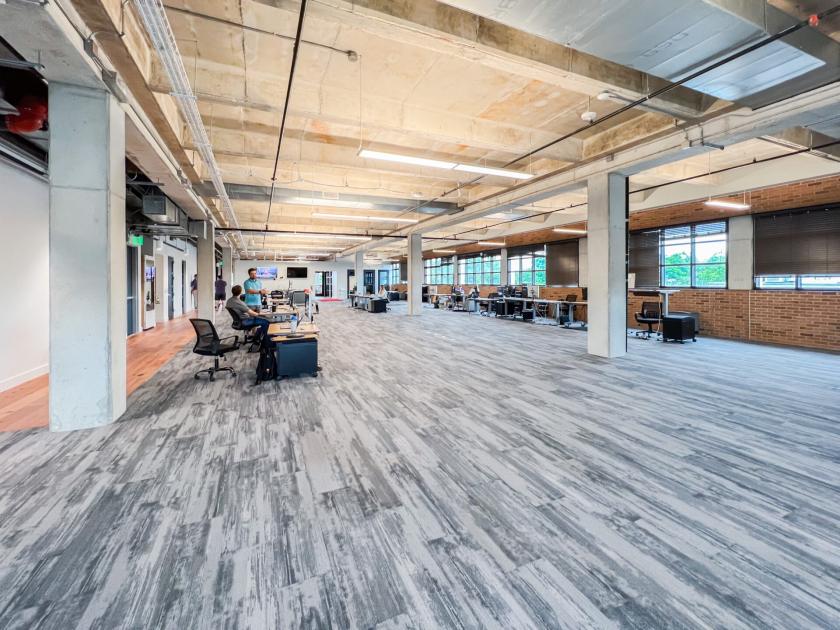
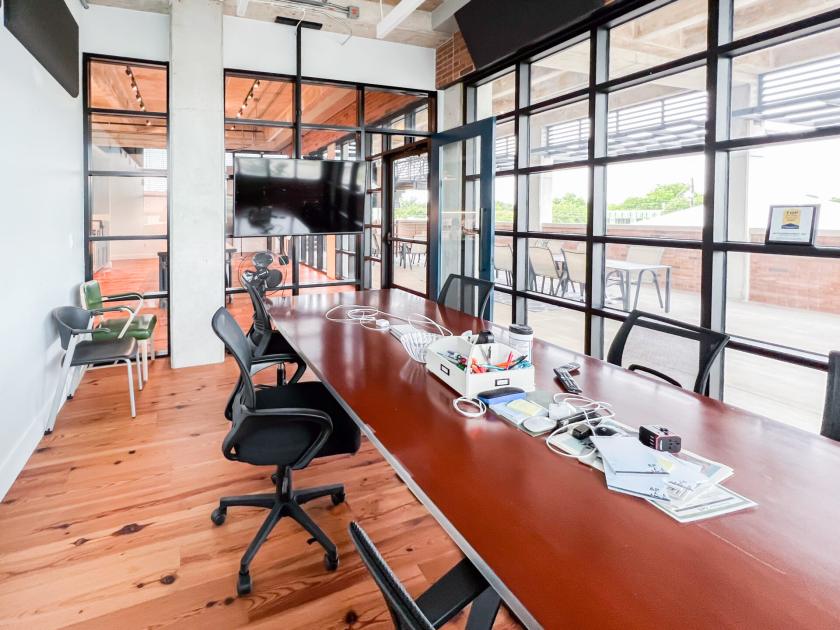
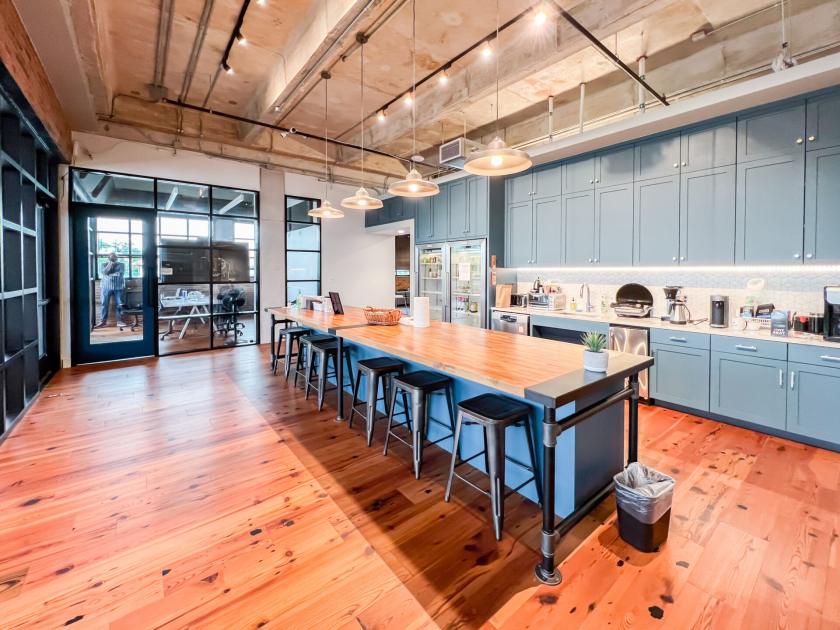
• Majority open office space with a break room, two conference rooms and multiple meeting/phone rooms
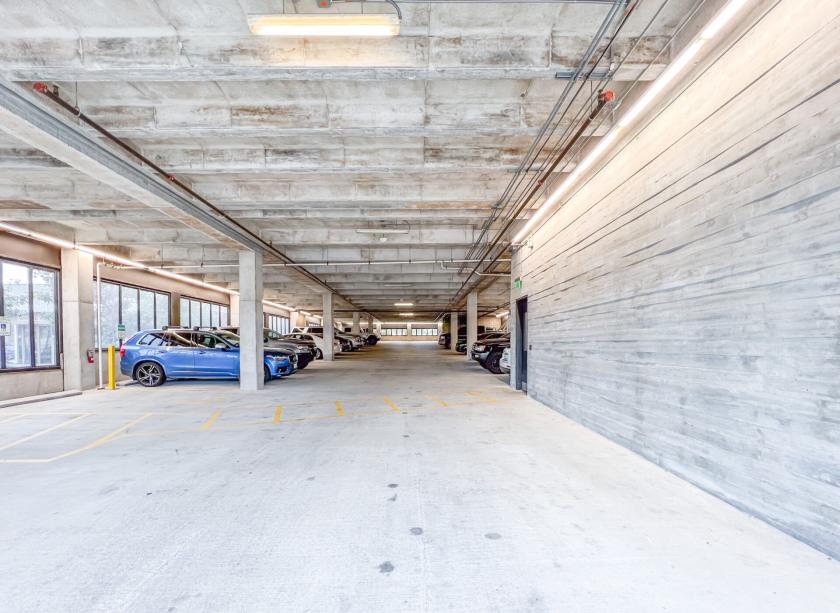
• Two floors of private covered parking as well as ample street parking available nearby
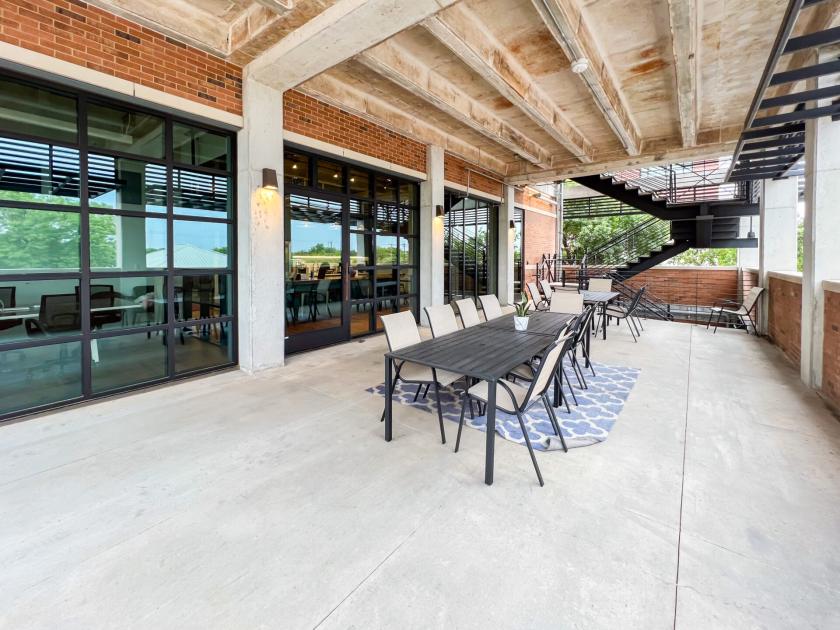
Additional Photos


Listing Agents

Michael Waters
M: 512-538-0077
mwaters@hpitx.com
M: 512-538-0077
mwaters@hpitx.com
While we strive to provide the most accurate information, all listing information, and demographic data, is provided by third-parties. As such, MyEListing will not be responsible for the accuracy of the information. It is strongly recommended that you verify all information with the listing agent, and any relevant agencies, prior to making any decisions.