Office Space
3600 N Capital of Texas Hwy - Building B - Sublease Austin, TX 78746
3600 N Capital of Texas Hwy - Building B - Sublease Austin, TX 78746

Details & Description
Property Highlights
- • 2 phone room pods and 1 group pod in the space
- • Furniture negotiable
- • Hill country views
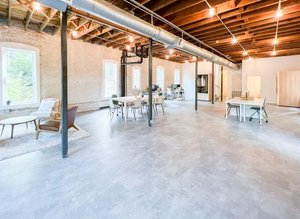
Additional Photos


Listing Agents

Kendall King
O: 512-538-0093
king@hpitx.com
O: 512-538-0093
king@hpitx.com
While we strive to provide the most accurate information, all listing information, and demographic data, is provided by third-parties. As such, MyEListing will not be responsible for the accuracy of the information. It is strongly recommended that you verify all information with the listing agent, and any relevant agencies, prior to making any decisions.