Office Space
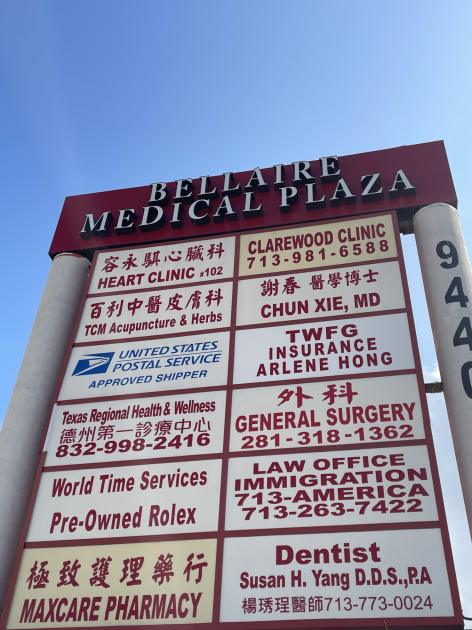
9440 Bellaire Boulevard Houston, TX 77036
9440 Bellaire Boulevard Houston, TX 77036
Details & Description
Property Highlights
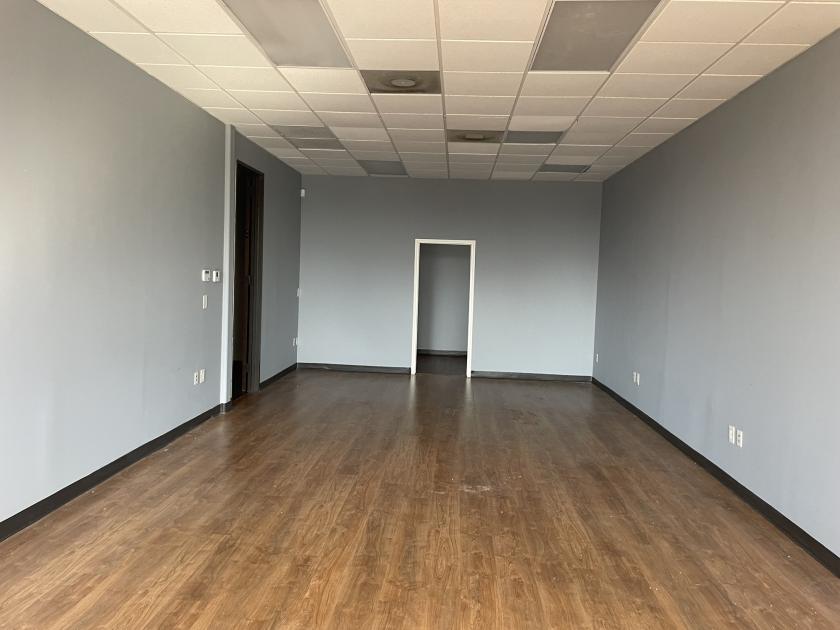
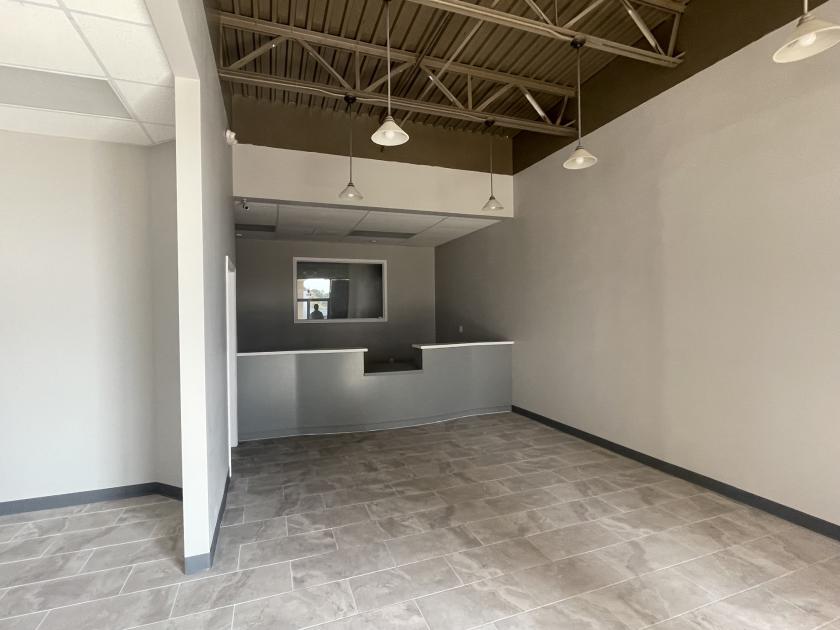
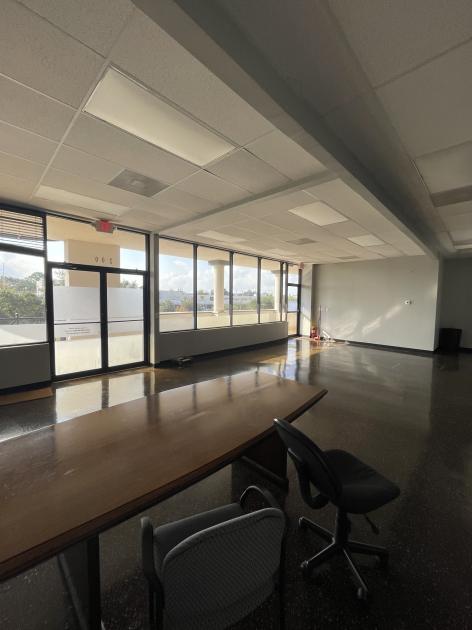
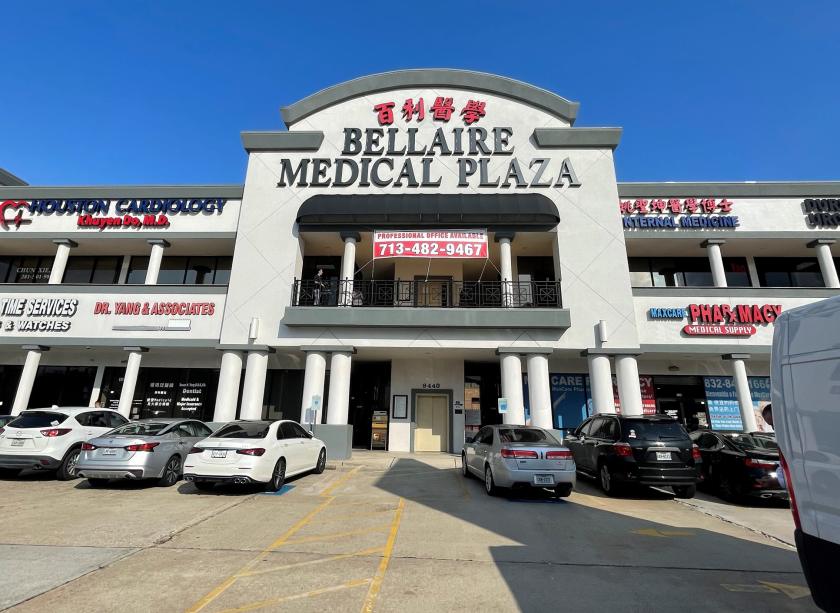
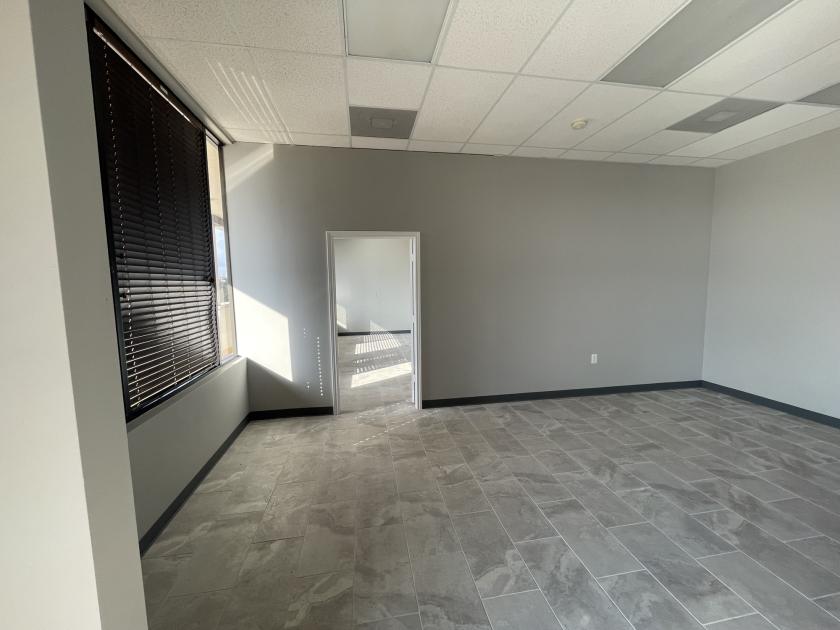
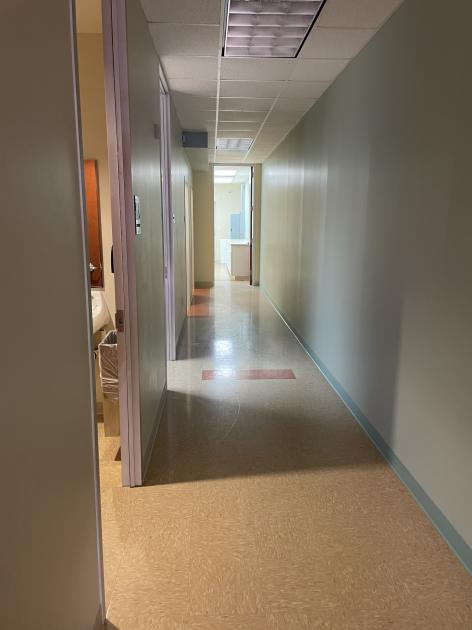
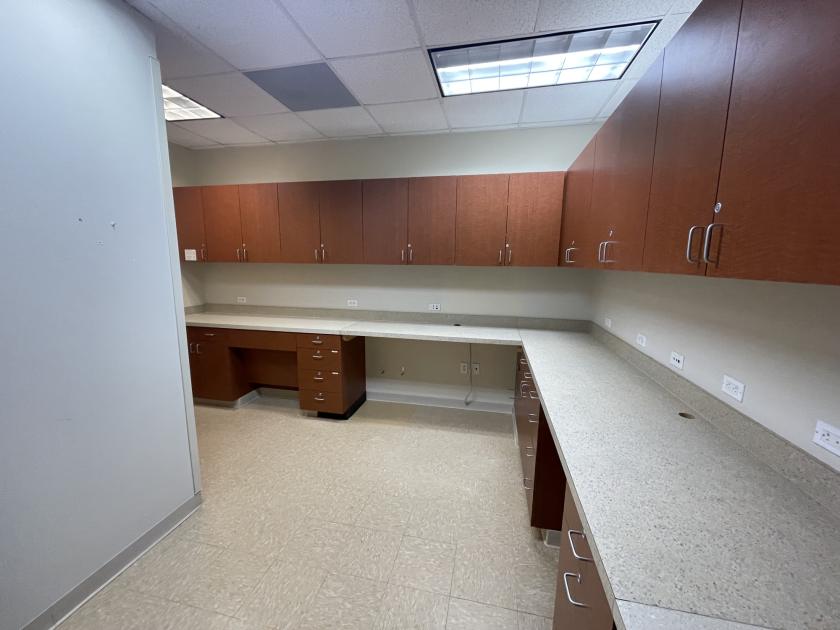
• Professional office/medical spaces available in busy 49,020 SF neighborhood center on Bellaire Boulevard
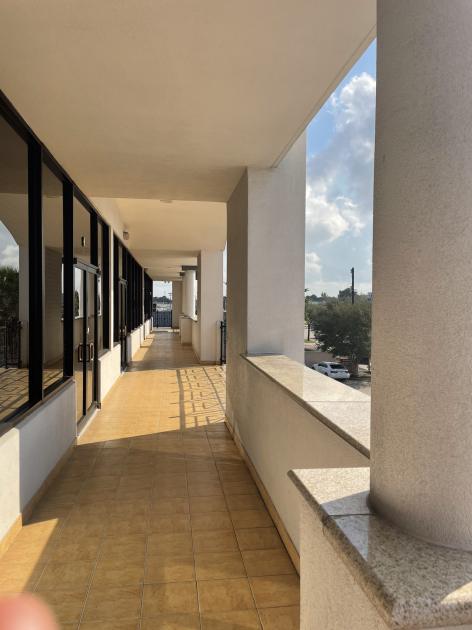
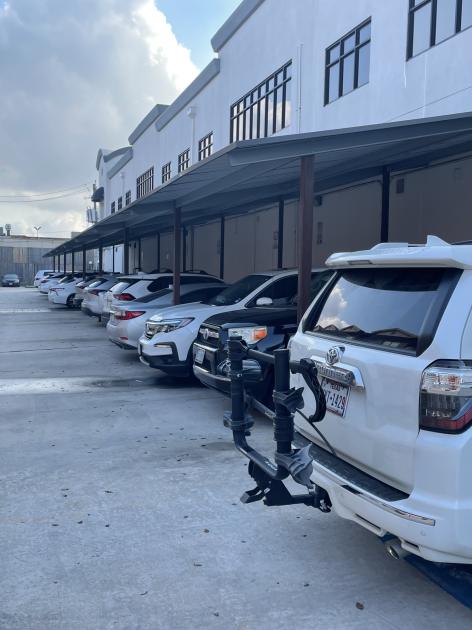
• Conveniently located just one block east of Beltway 8/Sam Houston Tollway
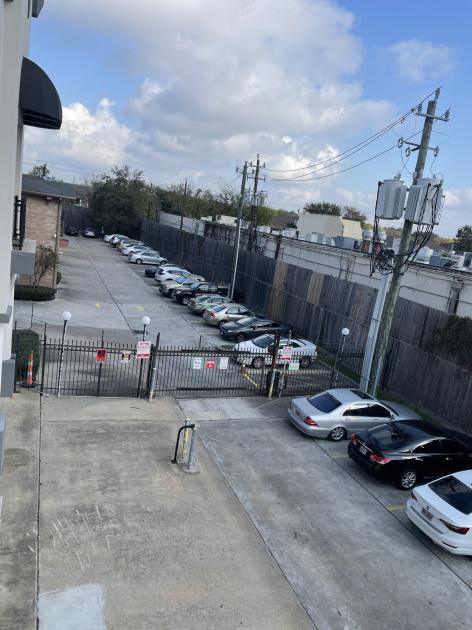
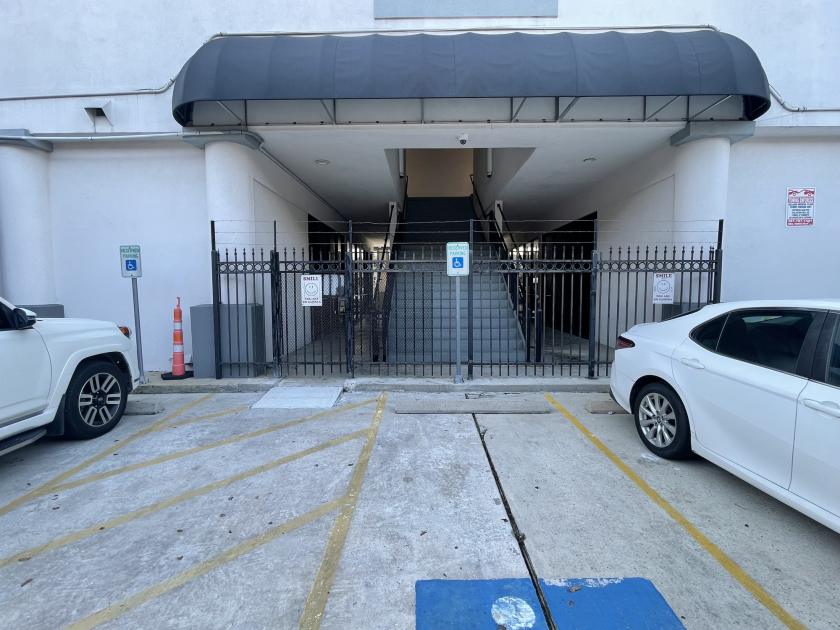
Additional Photos
Listing Agents

Doug Larson
O: 713-473-7200
M: 713-824-3799
doug@texascres.com
O: 713-473-7200
M: 713-824-3799
doug@texascres.com

Chris Joyce
O: 713-473-7200
M: 936-577-0836
chris@texascres.com
O: 713-473-7200
M: 936-577-0836
chris@texascres.com

Adria Martinez
O: 713-473-7200
M: 713-459-4483
adria@texascres.com
O: 713-473-7200
M: 713-459-4483
adria@texascres.com
While we strive to provide the most accurate information, all listing information, and demographic data, is provided by third-parties. As such, MyEListing will not be responsible for the accuracy of the information. It is strongly recommended that you verify all information with the listing agent, and any relevant agencies, prior to making any decisions.