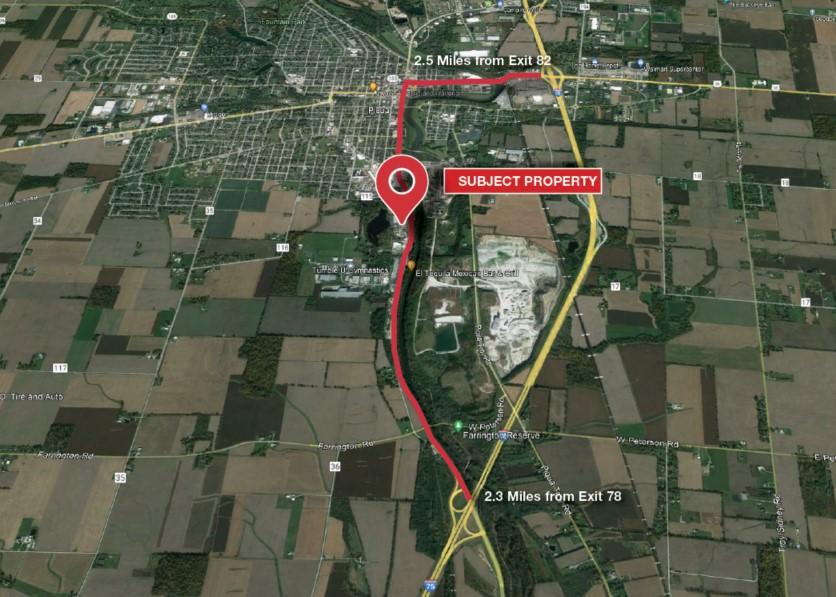
1-Mile | 3-Miles | 5-Miles | ||
---|---|---|---|---|
Total Population | 2,540 | 18,639 | 28,660 | |
Population Median Age | 37 | 39 | 41 | |
Population by Age | 0-9 Yrs | 347 (13%) | 2158 (11%) | 3055 (10%) |
10-19 Yrs | 379 (14%) | 2833 (15%) | 3953 (13%) | |
20-29 Yrs | 214 (8%) | 2275 (12%) | 3322 (11%) | |
30-39 Yrs | 440 (17%) | 2371 (12%) | 3462 (12%) | |
40-49 Yrs | 344 (13%) | 2619 (14%) | 3857 (13%) | |
50-59 Yrs | 420 (16%) | 2389 (12%) | 3744 (13%) | |
60-69 Yrs | 237 (9%) | 2127 (11%) | 3789 (13%) | |
70+ Yrs | 158 (6%) | 1866 (10%) | 3479 (12%) | |
Median HH Income | $36,601 | $45,102 | $52,555 | |
Total Household Income | < 24K | 311 (29%) | 1826 (24%) | 2508 (21%) |
25-49K | 397 (37%) | 2159 (29%) | 2979 (26%) | |
50-74K | 248 (23%) | 1431 (19%) | 2292 (20%) | |
75-99K | 34 (3%) | 960 (12%) | 1608 (14%) | |
100-199K | 72 (6%) | 959 (12%) | 1881 (16%) | |
200K+ | 7 (0%) | 50 (0%) | 184 (1%) | |
Highest Education Level | No Diploma | 213 | 1414 | 1968 |
Diploma or GED | 1052 | 5534 | 8545 | |
Some College | 320 | 2801 | 4402 | |
Assoc. Degree | 66 | 1330 | 2113 | |
Bachelors Degree | 44 | 991 | 1951 | |
Higher Degree | 11 | 564 | 1129 | |
Total Housing Units | 1,157 | 8,121 | 12,463 | |
--Owner-Occupied | 612 | 4,392 | 7,281 | |
--Renter-Occupied | 457 | 2,994 | 4,172 | |
Owner-Occupied Values | < 100K | 564 | 2753 | 3259 |
100-199K | 35 | 1243 | 2602 | |
200-299K | 11 | 305 | 1020 | |
300-399K | 2 | 47 | 285 | |
400-499K | 0 | 24 | 56 | |
500K+ | 0 | 20 | 59 | |
Total Working Age Population | 1,947 | 14,656 | 23,076 | |
In Work Force | 1,422 | 9,577 | 14,579 | |
Not In Work Force | 525 | 5,079 | 8,498 | |
Workforce Employed | 1,402 | 9,192 | 13,951 | |
Workforce Unemployed | 19 | 380 | 597 | |
Civlian Workforce | 1,421 | 9,572 | 14,547 | |
Military Workforce | 0 | 5 | 31 | |
Total Households | 1,069 | 7,386 | 11,453 | |
Family Households | 502 | 4,329 | 6,875 | |
Non-Family Households | 567 | 3,057 | 4,578 | |
Married Couple | 308 | 3,020 | 5,216 | |
Other Family | 194 | 1,308 | 1,659 | |
Married w/Child | 139 | 1,161 | 1,820 | |
Single Male w/Child | 69 | 218 | 264 | |
Single Female w/Child | 59 | 557 | 639 |
Population Change Last Two Decades - Plus Projection
2000 | % | 2010 | % | 2020 | % | 2030 | |
---|---|---|---|---|---|---|---|
Ohio | 11,353,140 | +2 | 11,536,504 | 0 | 11,574,870 | 0 | 11,615,100 |
Shelby County | 47,910 | +3 | 49,423 | 0 | 49,290 | -2 | 48,240 |
Miami County | 98,868 | +4 | 102,506 | 0 | 102,590 | +1 | 103,500 |
Total Working Age Population:
Total Households:
Total Working Age Population:
Total Households:
Total Working Age Population:
Total Households: