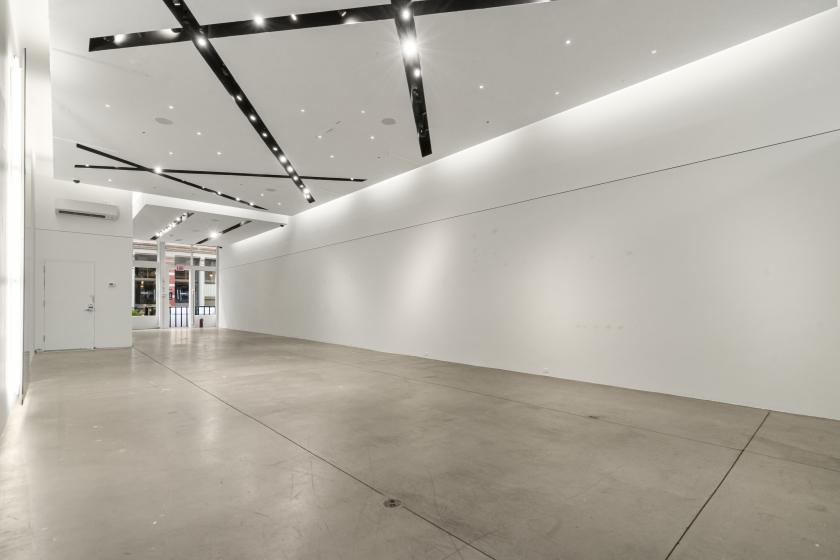
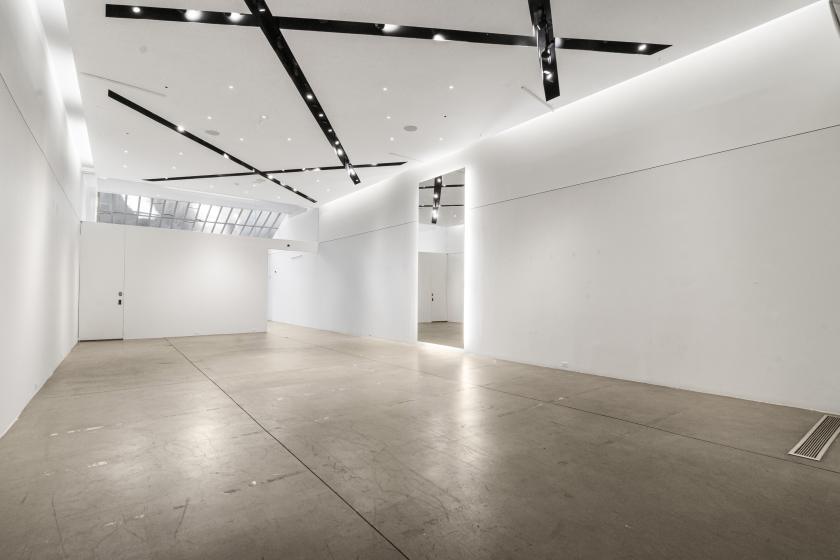
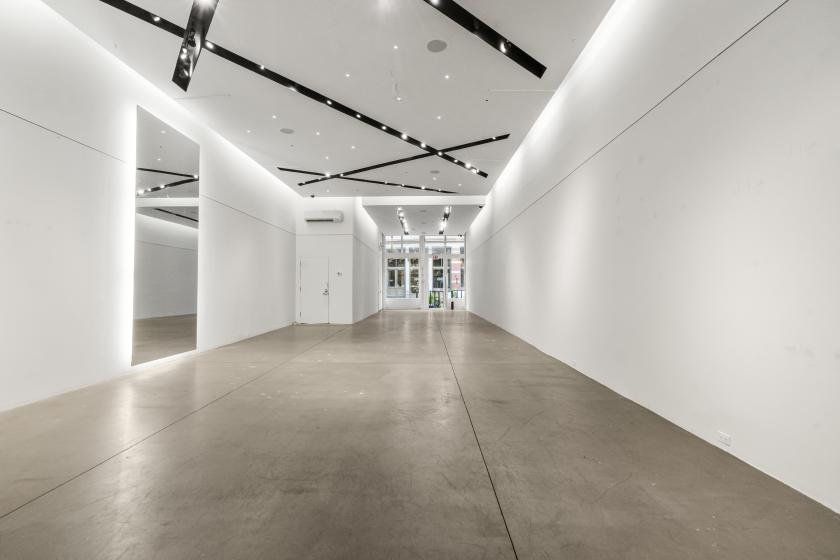
This bright and airy space boasts an open layout with magnificent 17-foot ceilings and expansive windows that flood the room with natural light. The recessed track lighting and skylight-illuminated checkout create an inviting ambiance that is perfect for a gallery showroom.
Our blade signage and suspended-hanging LED ceiling are just a few of the standout features that make this space truly exceptional. And for those in need of extra storage, we have an additional 2,400 square feet of basement space available for lease.
Perfect for companies looking for a short term commitment or downsizing, this space offers flexibility without compromising on style.
For Lease by Owner with Full Commission, we offer a discount for one year prepaid with copublicity. If you're in the market for a pop-up shop, look no further - this space is ideal for showcasing your brand in a truly unique and fashion-forward setting.
No part of this information may be copied, reproduced, repurposed, or screen-captured for any commercial purpose without prior written authorization from MyEListing.
While we strive to provide the most accurate information, all listing information, and demographic data, is provided by third-parties. As such, MyEListing will not be responsible for the accuracy of the information. It is strongly recommended that you verify all information with the listing agent, and any relevant agencies, prior to making any decisions.
What is the asking price for 39 Wooster Street- Retail in New York?
The asking price for 39 Wooster Street- Retail is $114.72 a SF per Year
What is the building size of this commercial Retail property?
The size of this lease property at '.39 Wooster Street- Retail.' is 2500 square feet
What kind of Retail is the propery at 39 Wooster Street- Retail?
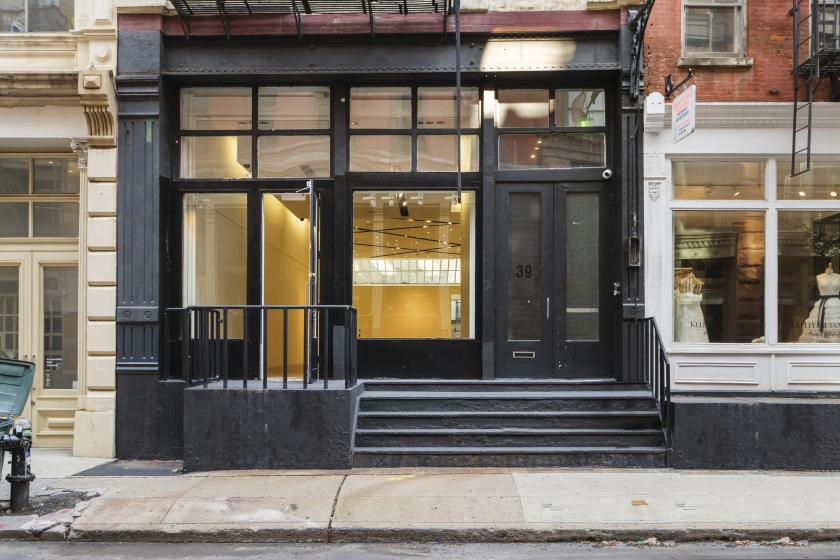
The property at 39 Wooster Street- Retail New York, NY 10013 is listed as a Other Retail Retail property
What is the population within 1 mile of 39 Wooster Street- Retail in New York?
The population within 1 mile of 39 Wooster Street- Retail New York, NY 10013 is 185,780 people.
Who do I contact for questions about 39 Wooster Street- Retail?
You should contact the listing agent,
John Pasquale, for any details regarding this commercial listing.