Retail Space
7919 Gunn Highway Tampa, FL 33626
7919 Gunn Highway Tampa, FL 33626
Details & Description
Property Highlights
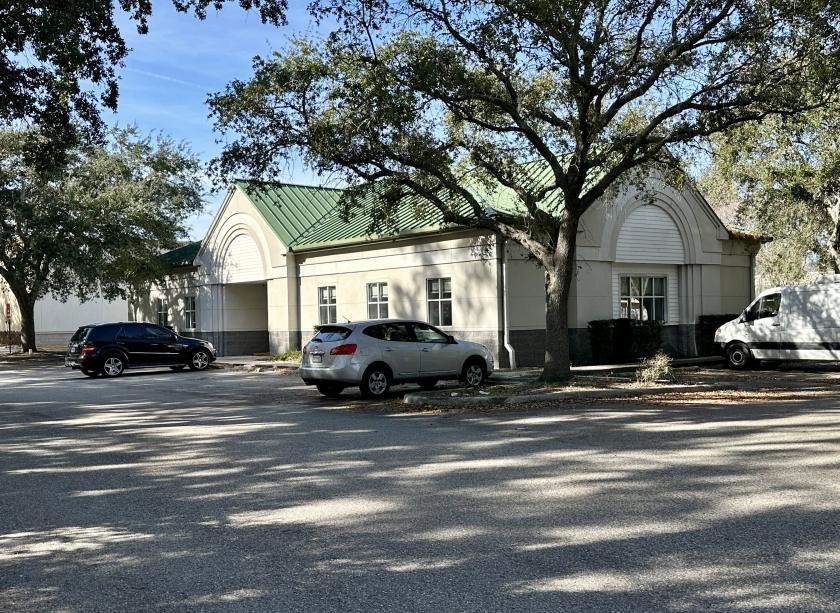
- • Plenty of Parking and Monument Signage
- • 35 Linear Feet of frontage on Gunn Hwy
- • 20 Parking spaces for a 5.6/1,000 parking ratio
- • CPV-G-5 Zoning with a Future Land use of CPV
- • 36,000 AADT on Gunn Hwy & Sheldon Rd
- • Monument Sign at entry on Gunn Hwy
Additional Photos


Listing Agents

Elliott Ross
O: 813-755-6700
M: 727-639-3800
elliott@255echomike.com
O: 813-755-6700
M: 727-639-3800
elliott@255echomike.com

Chris Shryock
O: 813-755-6700
M: 727-412-5166
chris@rossrealtytampabay.com
O: 813-755-6700
M: 727-412-5166
chris@rossrealtytampabay.com
While we strive to provide the most accurate information, all listing information, and demographic data, is provided by third-parties. As such, MyEListing will not be responsible for the accuracy of the information. It is strongly recommended that you verify all information with the listing agent, and any relevant agencies, prior to making any decisions.


