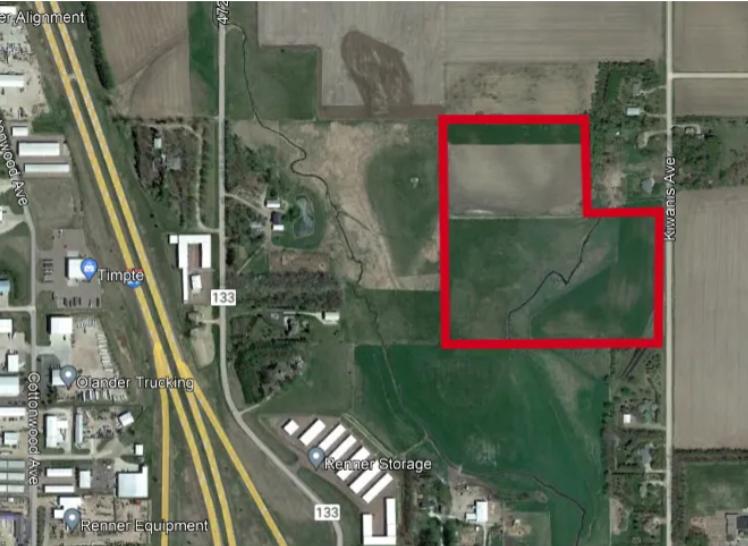
1-Mile | 3-Miles | 5-Miles | ||
---|---|---|---|---|
Total Population | 392 | 2,661 | 7,895 | |
Population Median Age | 38 | 37 | 34 | |
Population by Age | 0-9 Yrs | 71 (18%) | 453 (17%) | 1335 (16%) |
10-19 Yrs | 44 (11%) | 325 (12%) | 957 (12%) | |
20-29 Yrs | 59 (15%) | 383 (14%) | 1489 (18%) | |
30-39 Yrs | 29 (7%) | 247 (9%) | 1011 (12%) | |
40-49 Yrs | 42 (10%) | 323 (12%) | 977 (12%) | |
50-59 Yrs | 53 (13%) | 346 (13%) | 899 (11%) | |
60-69 Yrs | 53 (13%) | 337 (12%) | 706 (8%) | |
70+ Yrs | 41 (10%) | 247 (9%) | 520 (6%) | |
Median HH Income | $76,504 | $80,439 | $72,200 | |
Total Household Income | < 24K | 18 (13%) | 108 (11%) | 386 (13%) |
25-49K | 19 (13%) | 129 (13%) | 528 (17%) | |
50-74K | 30 (21%) | 195 (20%) | 620 (21%) | |
75-99K | 24 (17%) | 165 (17%) | 506 (17%) | |
100-199K | 38 (27%) | 281 (29%) | 788 (26%) | |
200K+ | 9 (6%) | 59 (6%) | 120 (4%) | |
Highest Education Level | No Diploma | 18 | 109 | 303 |
Diploma or GED | 72 | 494 | 1403 | |
Some College | 66 | 428 | 1230 | |
Assoc. Degree | 33 | 233 | 706 | |
Bachelors Degree | 49 | 355 | 1013 | |
Higher Degree | 19 | 128 | 366 | |
Total Housing Units | 141 | 963 | 3,068 | |
--Owner-Occupied | 118 | 807 | 2,072 | |
--Renter-Occupied | 20 | 130 | 875 | |
Owner-Occupied Values | < 100K | 17 | 94 | 215 |
100-199K | 36 | 265 | 774 | |
200-299K | 32 | 228 | 611 | |
300-399K | 22 | 153 | 298 | |
400-499K | 8 | 49 | 129 | |
500K+ | 3 | 17 | 44 | |
Total Working Age Population | 295 | 2,011 | 5,995 | |
In Work Force | 226 | 1,555 | 4,713 | |
Not In Work Force | 69 | 456 | 1,282 | |
Workforce Employed | 220 | 1,517 | 4,595 | |
Workforce Unemployed | 4 | 26 | 97 | |
Civlian Workforce | 224 | 1,542 | 4,692 | |
Military Workforce | 2 | 12 | 21 | |
Total Households | 138 | 937 | 2,947 | |
Family Households | 107 | 732 | 1,980 | |
Non-Family Households | 30 | 205 | 967 | |
Married Couple | 90 | 619 | 1,549 | |
Other Family | 18 | 113 | 431 | |
Married w/Child | 33 | 244 | 698 | |
Single Male w/Child | 5 | 30 | 102 | |
Single Female w/Child | 5 | 39 | 205 |
Population Change Last Two Decades - Plus Projection
2000 | % | 2010 | % | 2020 | % | 2030 | |
---|---|---|---|---|---|---|---|
South Dakota | 754,844 | +8 | 814,180 | +9 | 889,447 | +7 | 951,885 |
Minnehaha County | 148,281 | +14 | 169,468 | +12 | 190,105 | +8 | 205,960 |
Total Working Age Population:
Total Households:
Total Working Age Population:
Total Households:
Total Working Age Population:
Total Households: