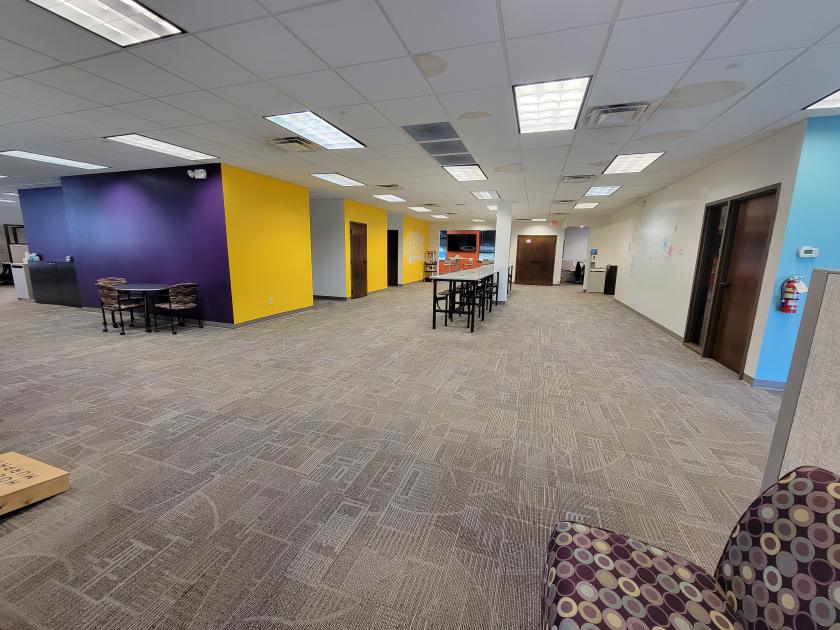
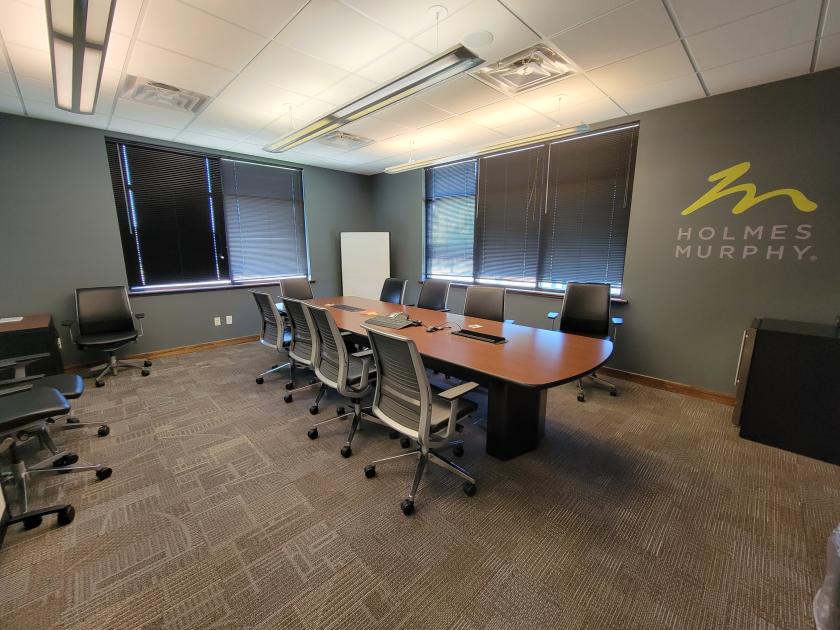
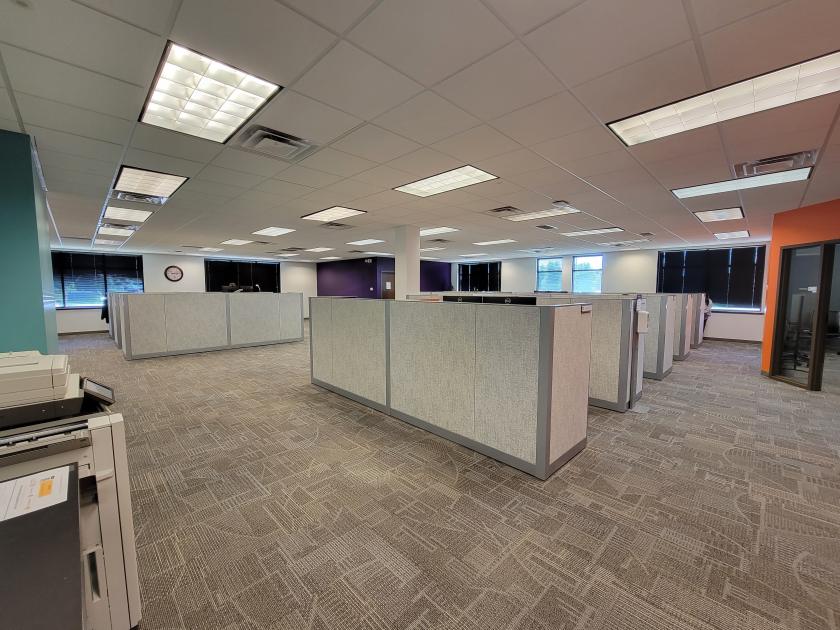
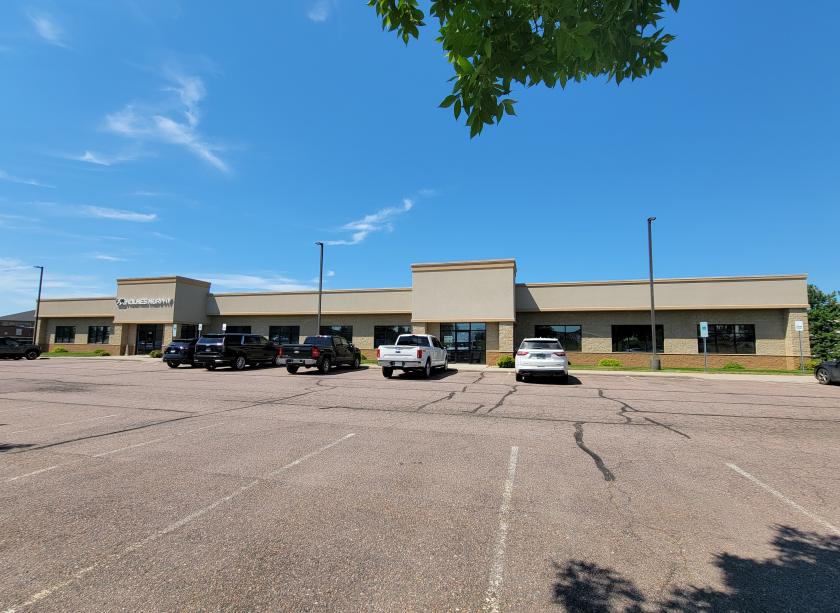
Office Space
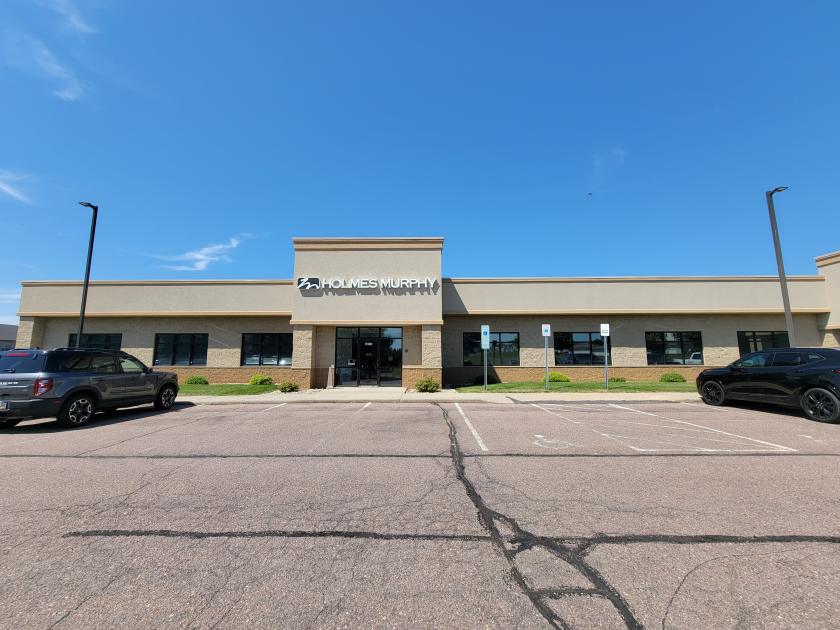
5116-5120 South Solberg Avenue Sioux Falls, SD 57108
5116-5120 South Solberg Avenue Sioux Falls, SD 57108
Details & Description
Property Highlights
- • Year built: 2004
- • Holmes Murphy will be relocating by January 2024
- • East suite could also be vacant spring 2024
- • Real Estate Taxes: $35,916.72
- • Lot Size: 1.6 AC
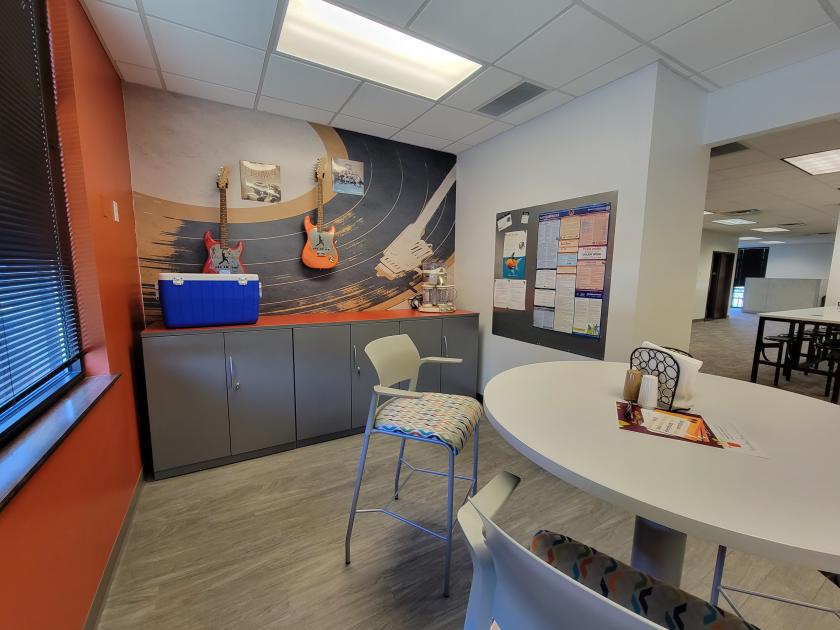
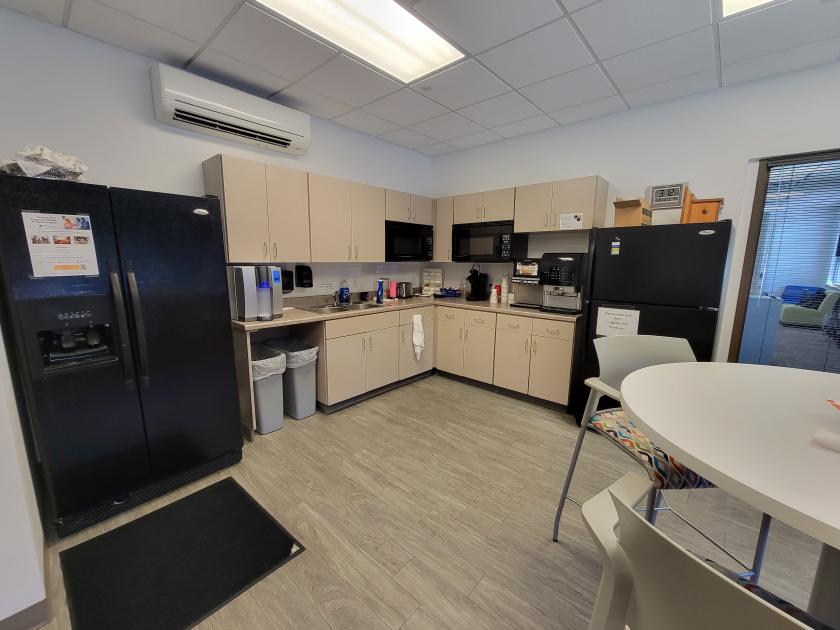
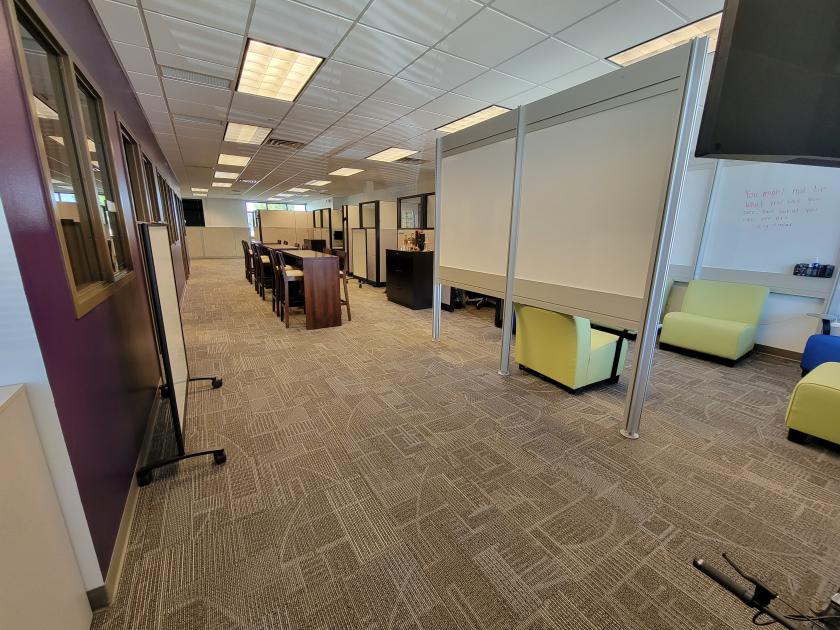
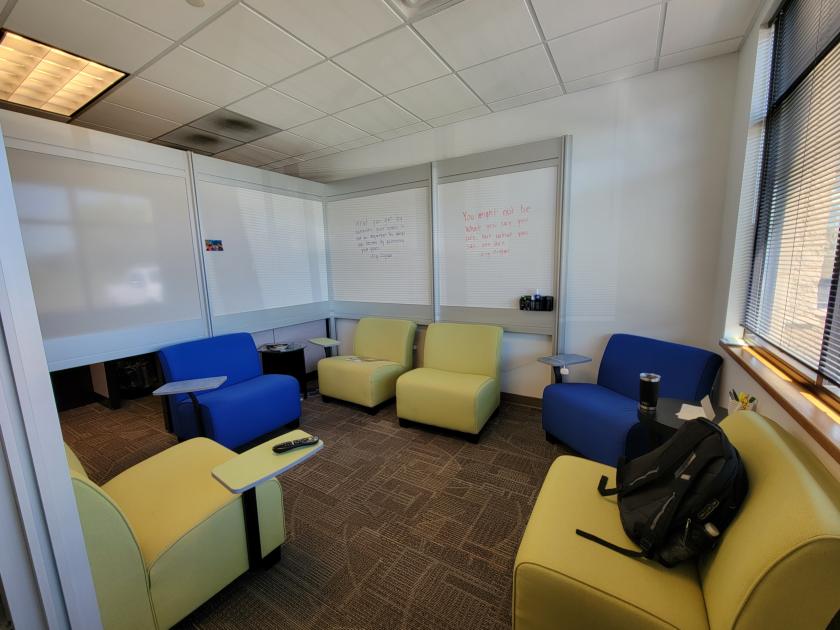
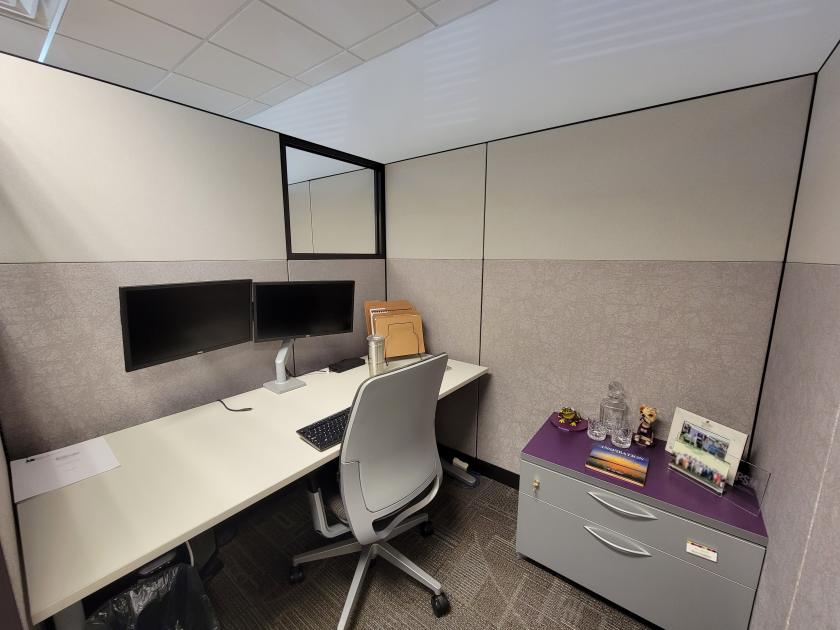
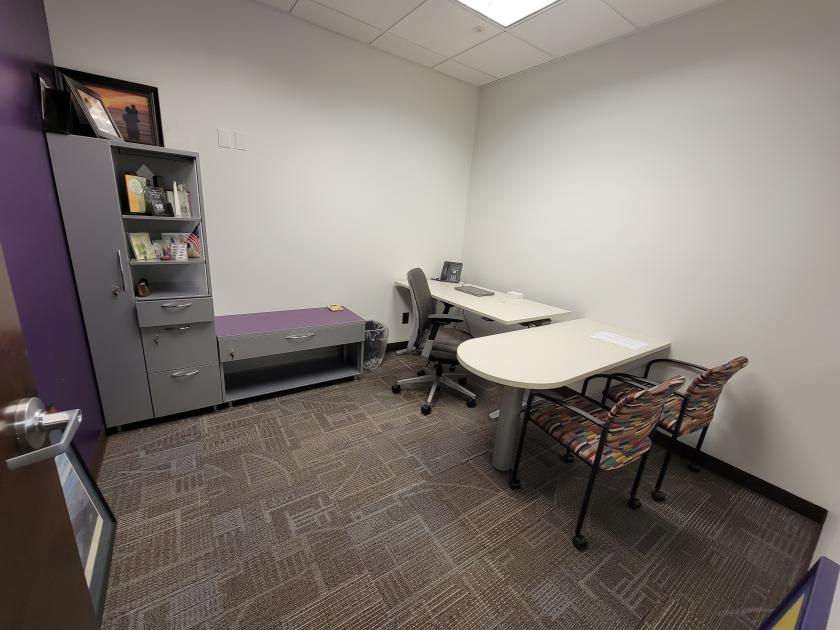
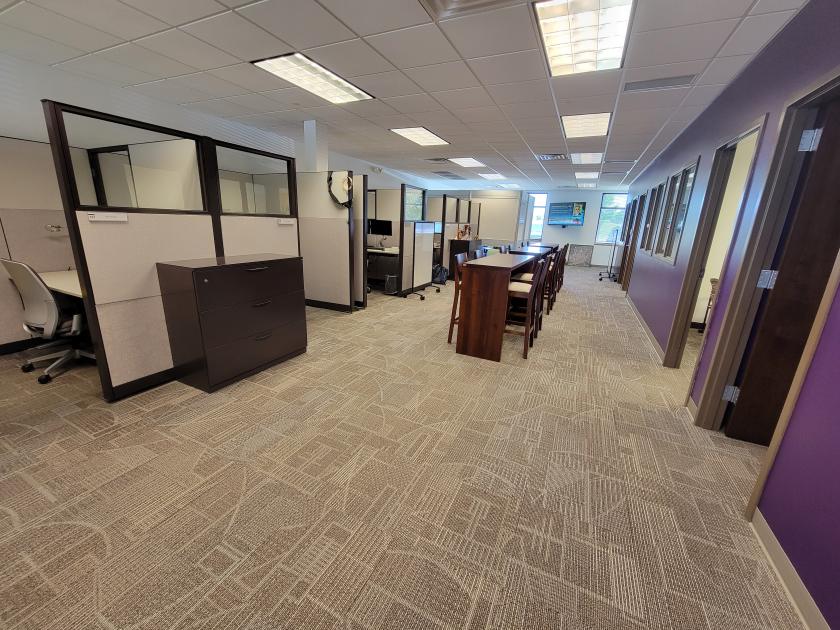
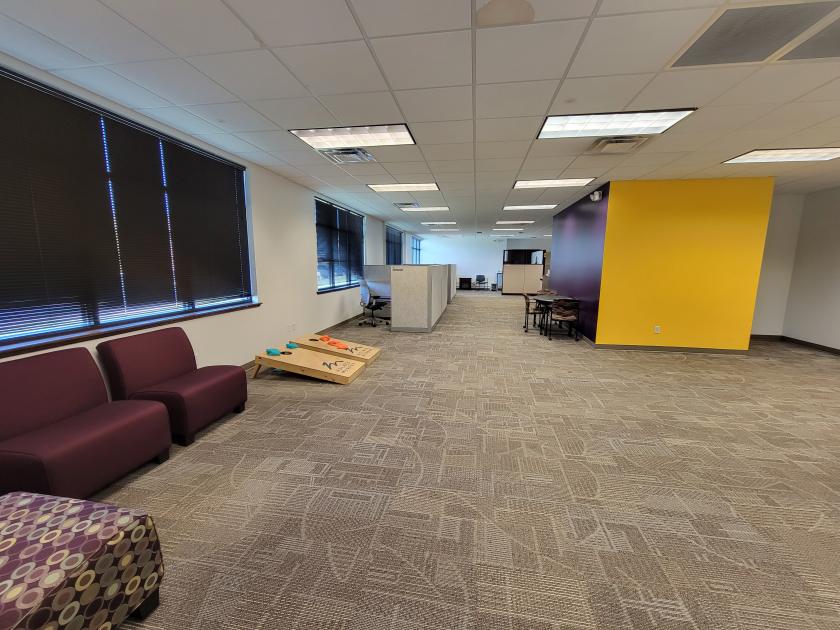
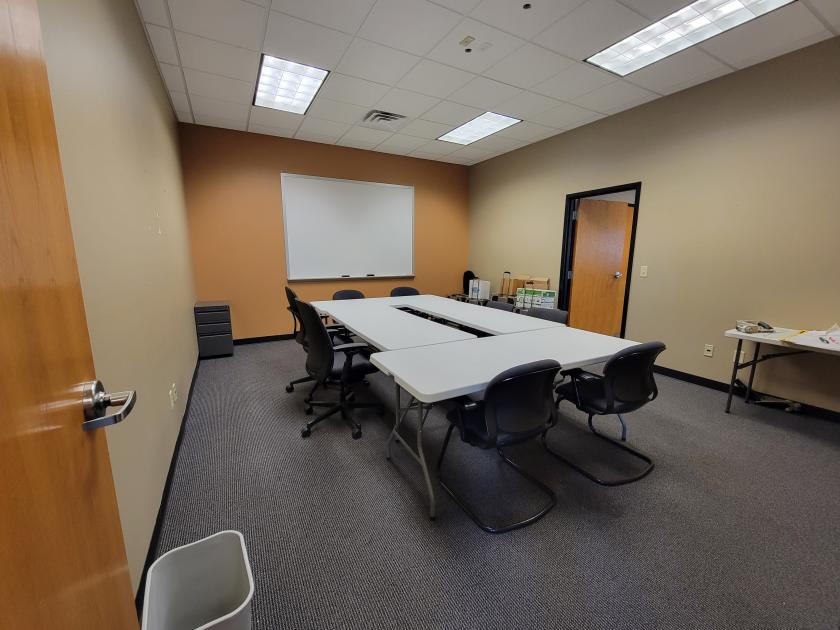
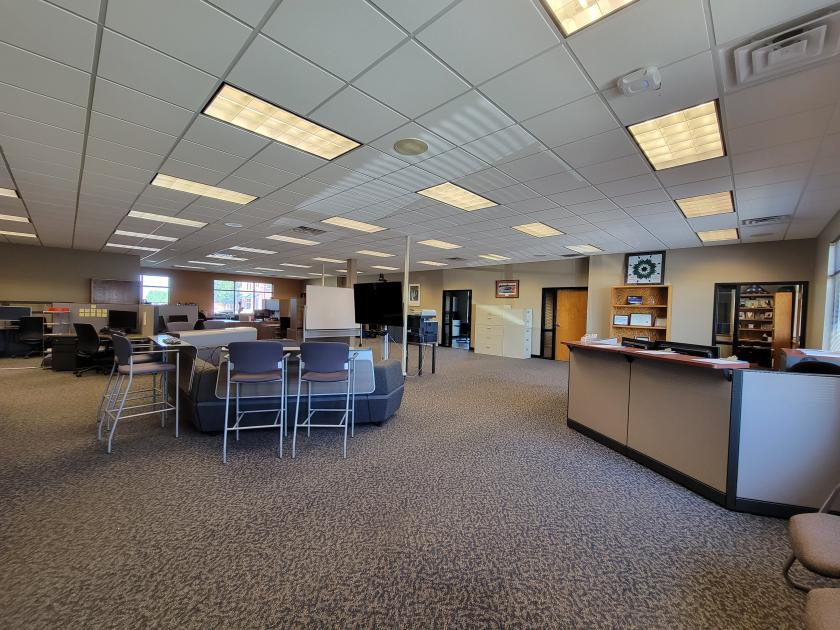
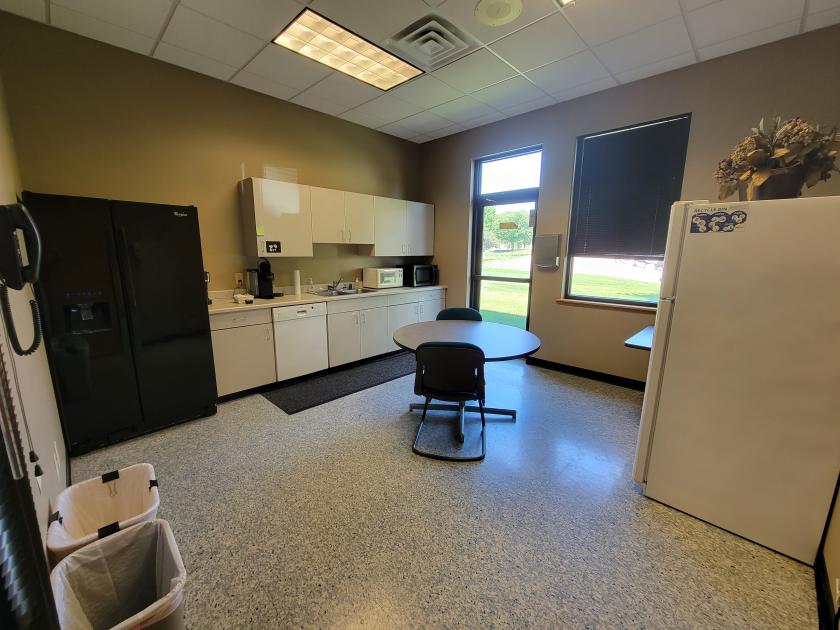
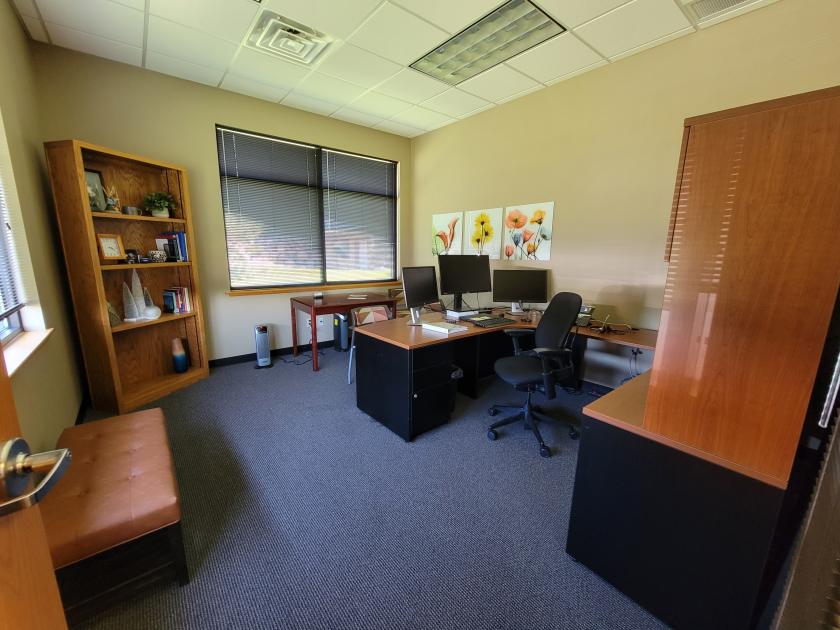
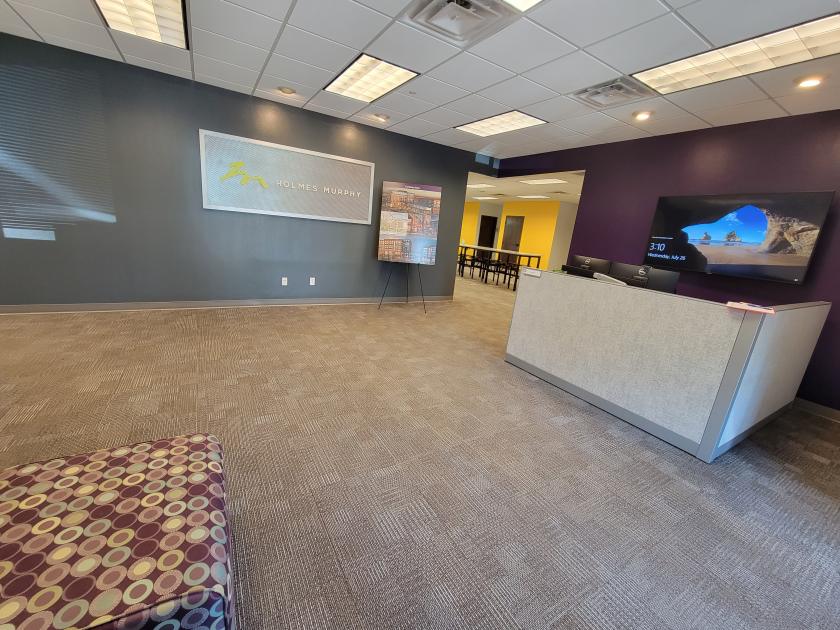
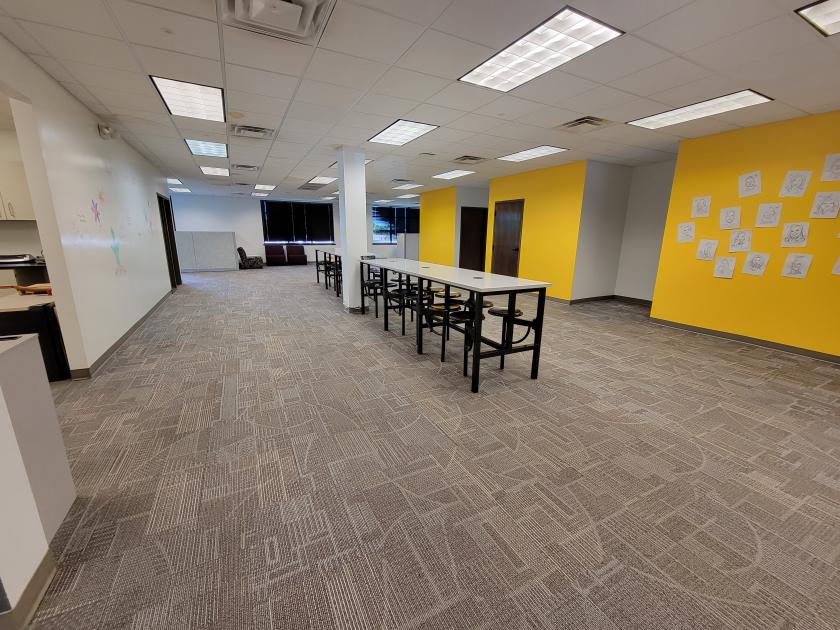
Additional Photos


Listing Agents

Dennis Breske
O: 605-444-7100
M: 605-310-6666
dbreske@naisiouxfalls.com
O: 605-444-7100
M: 605-310-6666
dbreske@naisiouxfalls.com
While we strive to provide the most accurate information, all listing information, and demographic data, is provided by third-parties. As such, MyEListing will not be responsible for the accuracy of the information. It is strongly recommended that you verify all information with the listing agent, and any relevant agencies, prior to making any decisions.