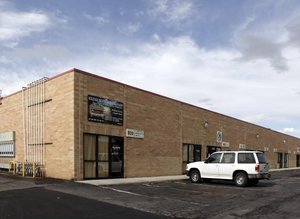
1-Mile | 3-Miles | 5-Miles | ||
---|---|---|---|---|
Total Population | 10,431 | 69,281 | 179,241 | |
Population Median Age | 34 | 33 | 34 | |
Population by Age | 0-9 Yrs | 1726 (16%) | 11289 (16%) | 27772 (15%) |
10-19 Yrs | 1516 (14%) | 10391 (14%) | 28209 (15%) | |
20-29 Yrs | 1849 (17%) | 12186 (17%) | 29012 (16%) | |
30-39 Yrs | 1762 (16%) | 10623 (15%) | 27270 (15%) | |
40-49 Yrs | 860 (8%) | 7447 (10%) | 21592 (12%) | |
50-59 Yrs | 908 (8%) | 6523 (9%) | 18426 (10%) | |
60-69 Yrs | 1103 (10%) | 5940 (8%) | 14549 (8%) | |
70+ Yrs | 707 (6%) | 4881 (7%) | 12412 (6%) | |
Median HH Income | $67,015 | $67,973 | $68,726 | |
Total Household Income | < 24K | 435 (11%) | 2638 (11%) | 7752 (13%) |
25-49K | 692 (19%) | 4986 (21%) | 12215 (20%) | |
50-74K | 1062 (29%) | 5598 (24%) | 13040 (22%) | |
75-99K | 574 (15%) | 4101 (17%) | 10028 (16%) | |
100-199K | 818 (22%) | 5231 (22%) | 14225 (24%) | |
200K+ | 60 (1%) | 557 (2%) | 1995 (3%) | |
Highest Education Level | No Diploma | 368 | 3467 | 9950 |
Diploma or GED | 2444 | 14435 | 33220 | |
Some College | 1662 | 11960 | 29971 | |
Assoc. Degree | 478 | 3735 | 10441 | |
Bachelors Degree | 1036 | 6533 | 18152 | |
Higher Degree | 339 | 2168 | 7069 | |
Total Housing Units | 3,686 | 24,573 | 63,232 | |
--Owner-Occupied | 2,442 | 17,138 | 42,657 | |
--Renter-Occupied | 1,198 | 5,972 | 16,598 | |
Owner-Occupied Values | < 100K | 549 | 1572 | 2968 |
100-199K | 805 | 5413 | 12489 | |
200-299K | 930 | 6748 | 15281 | |
300-399K | 101 | 2192 | 6830 | |
400-499K | 57 | 883 | 3352 | |
500K+ | 0 | 331 | 1736 | |
Total Working Age Population | 7,677 | 51,152 | 133,407 | |
In Work Force | 5,504 | 36,458 | 92,601 | |
Not In Work Force | 2,173 | 14,694 | 40,805 | |
Workforce Employed | 5,283 | 34,893 | 88,124 | |
Workforce Unemployed | 200 | 1,222 | 3,522 | |
Civlian Workforce | 5,483 | 36,115 | 91,646 | |
Military Workforce | 21 | 342 | 956 | |
Total Households | 3,640 | 23,111 | 59,255 | |
Family Households | 2,618 | 16,969 | 42,423 | |
Non-Family Households | 1,022 | 6,142 | 16,832 | |
Married Couple | 1,708 | 12,296 | 31,839 | |
Other Family | 910 | 4,673 | 10,584 | |
Married w/Child | 837 | 5,941 | 15,662 | |
Single Male w/Child | 371 | 1,068 | 2,353 | |
Single Female w/Child | 173 | 1,462 | 3,838 |
Population Change Last Two Decades - Plus Projection
2000 | % | 2010 | % | 2020 | % | 2030 | |
---|---|---|---|---|---|---|---|
Utah | 2,233,169 | +24 | 2,763,885 | +20 | 3,325,425 | +17 | 3,889,310 |
Davis County | 238,994 | +28 | 306,479 | +19 | 364,813 | +11 | 406,046 |
Weber County | 196,533 | +18 | 231,236 | +15 | 266,440 | +14 | 302,764 |
Total Working Age Population:
Total Households:
Total Working Age Population:
Total Households:
Total Working Age Population:
Total Households: