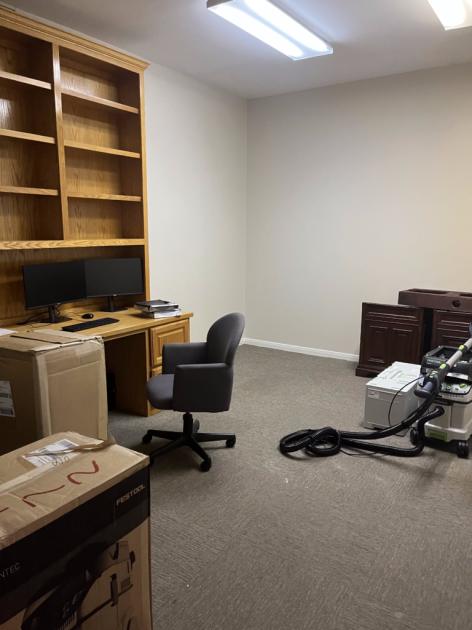
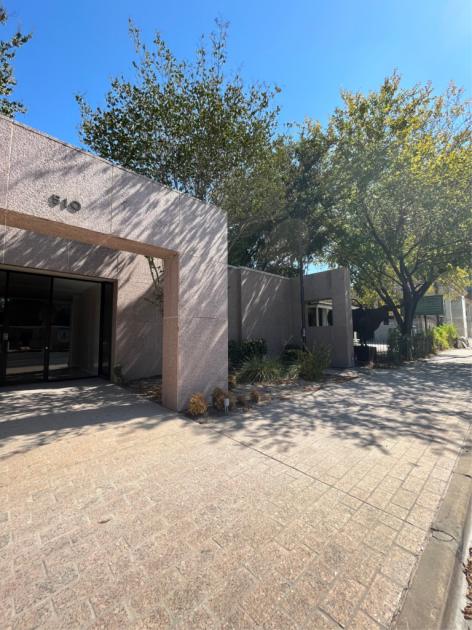
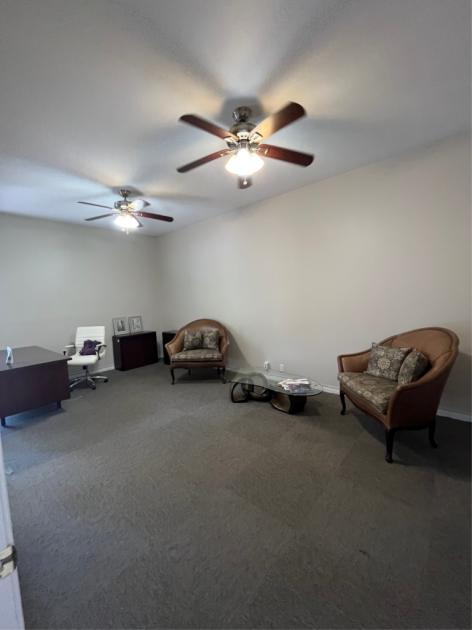
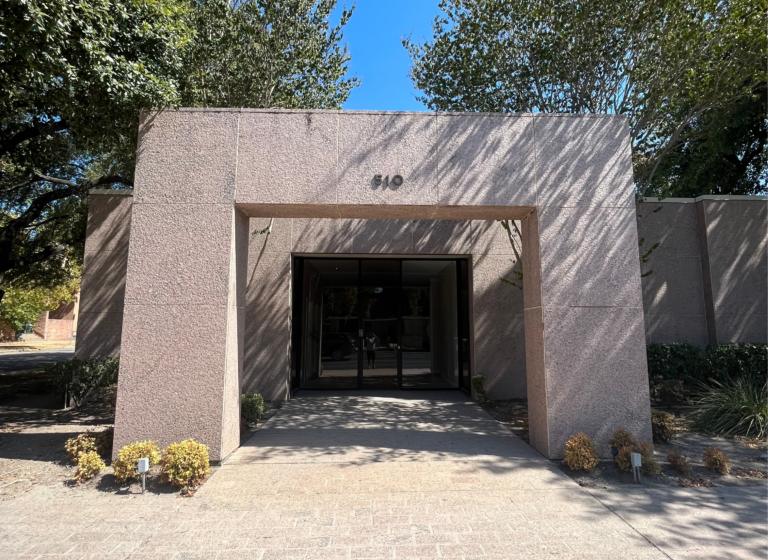
Office Space
510 West 15th Street Austin, TX 78701
510 West 15th Street Austin, TX 78701
Details & Description
Property Highlights
- • Excellent visibility
- • 5 Surface Parking Spaces
- • 6 Covered Parking Spaces
- • Exterior Signage Available
- • Granite Clad Exterior
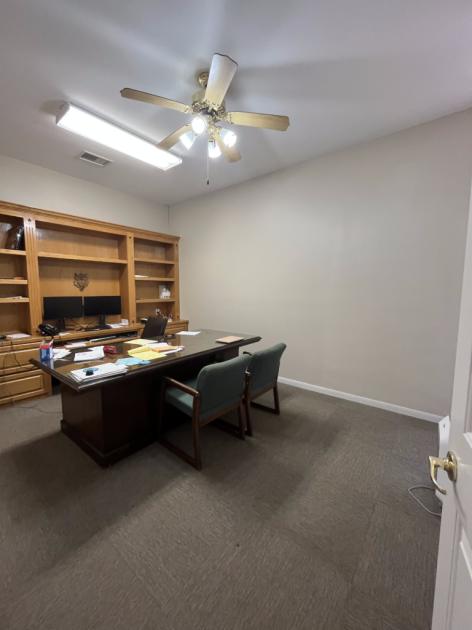
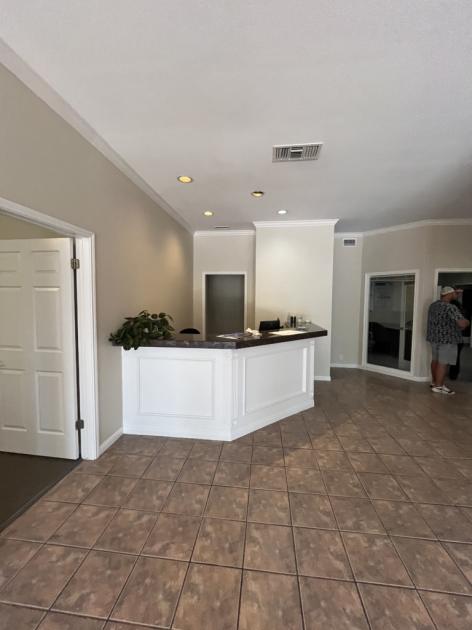
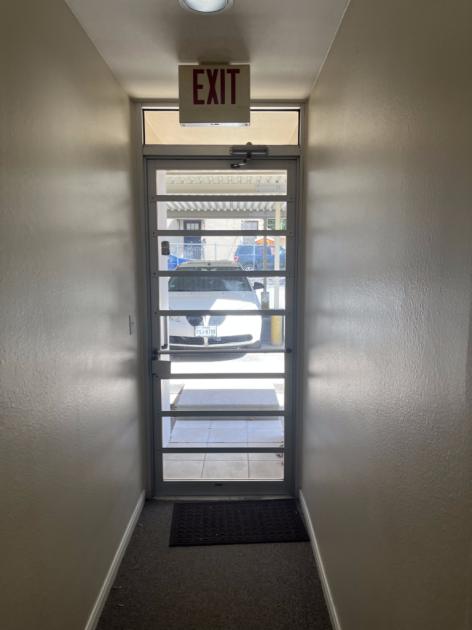
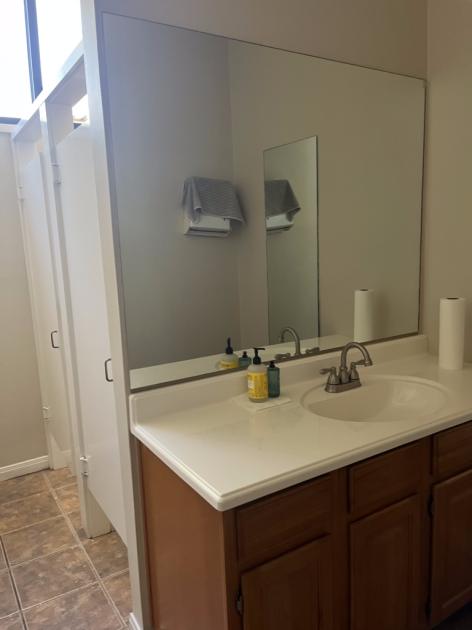
Additional Photos
Listing Agents

Ryan Frey
M: 214-450-8645
rfrey@practicerealestategroup.com
M: 214-450-8645
rfrey@practicerealestategroup.com
While we strive to provide the most accurate information, all listing information, and demographic data, is provided by third-parties. As such, MyEListing will not be responsible for the accuracy of the information. It is strongly recommended that you verify all information with the listing agent, and any relevant agencies, prior to making any decisions.