Office Space
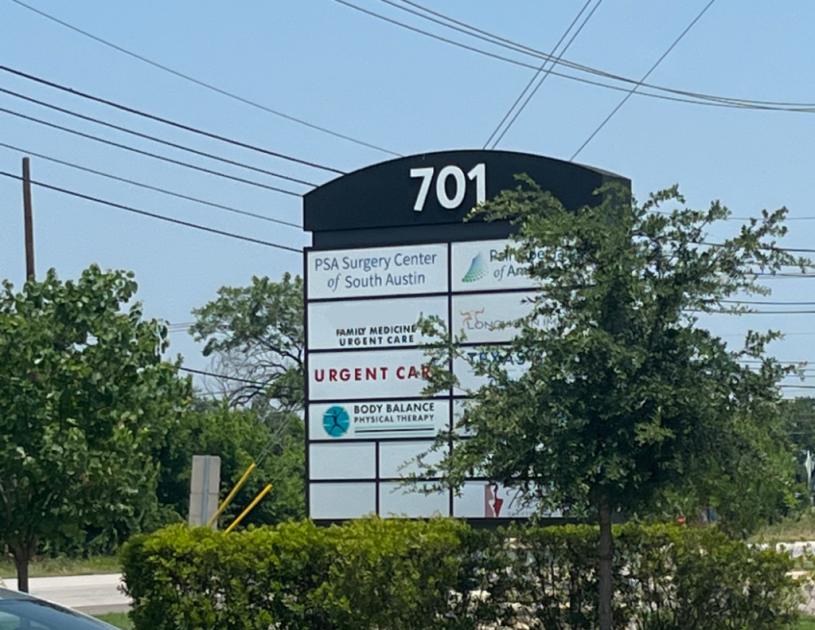
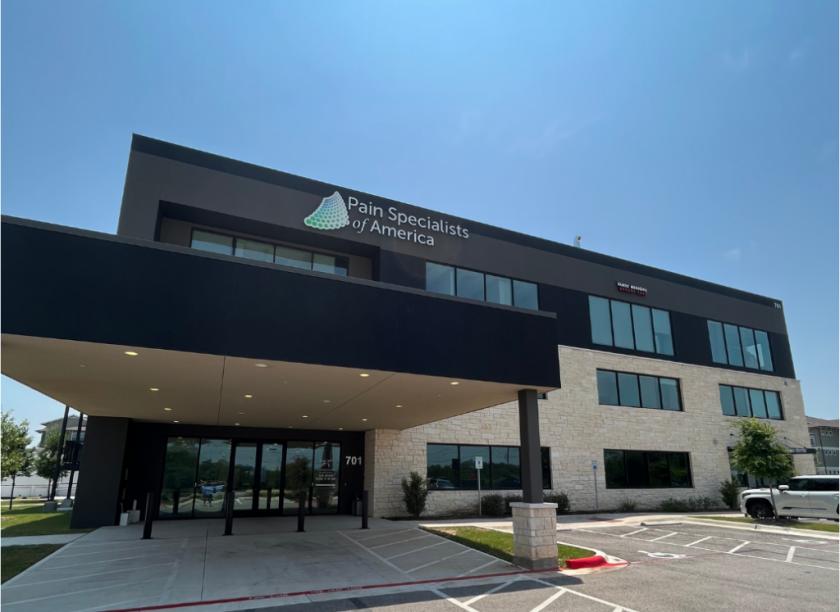
701 E FM1626 Road Austin, TX 78748
701 E FM1626 Road Austin, TX 78748
Details & Description
Property Highlights
• Premier visibility and location with convenient access to FM 1626, I-35, and other areas of South Austin
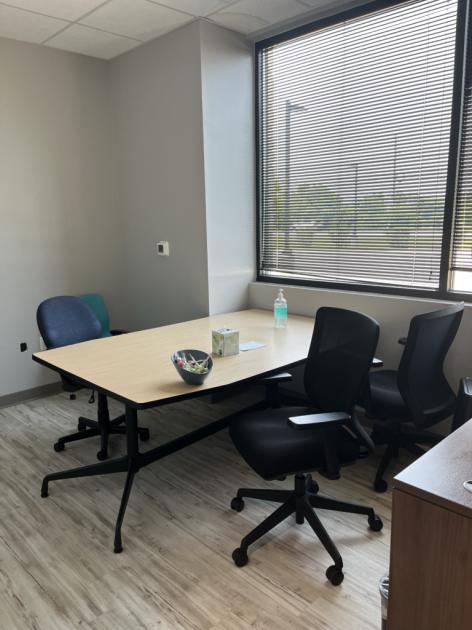
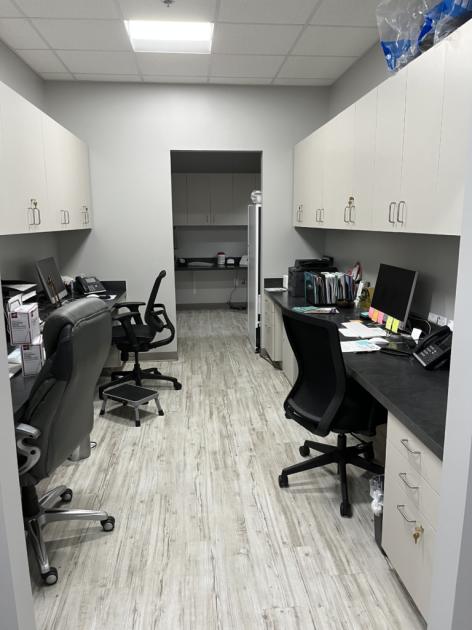
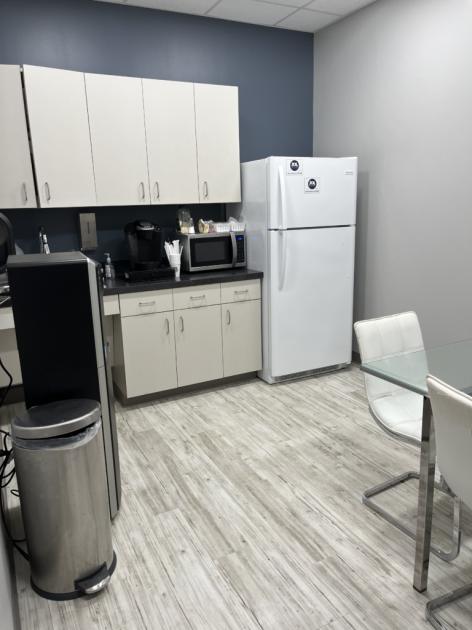
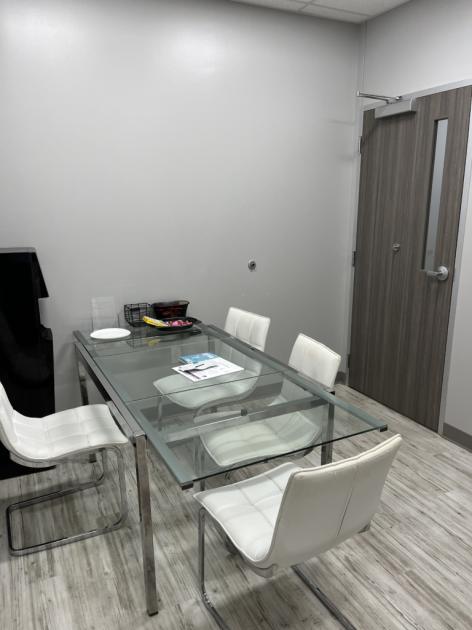
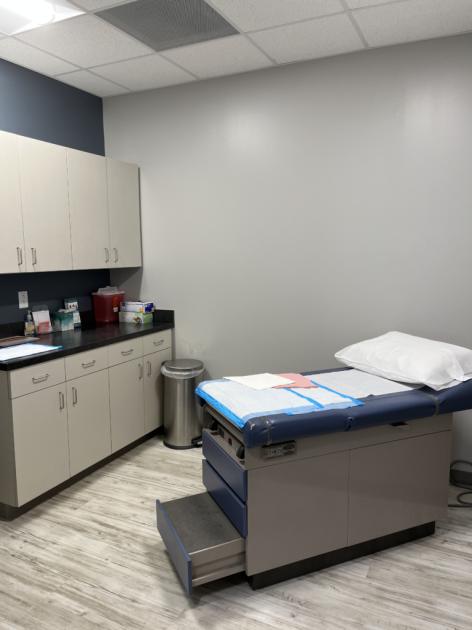
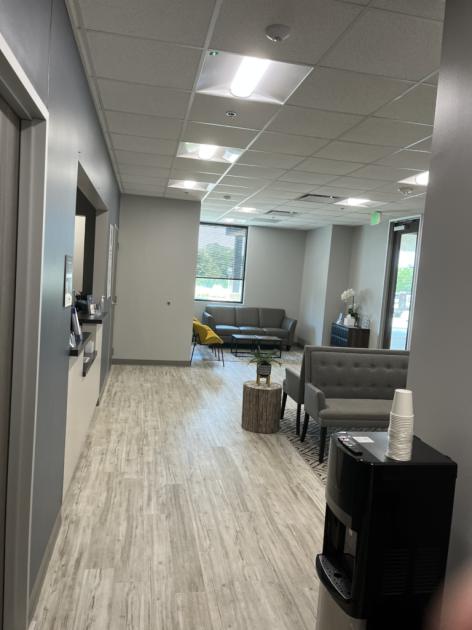
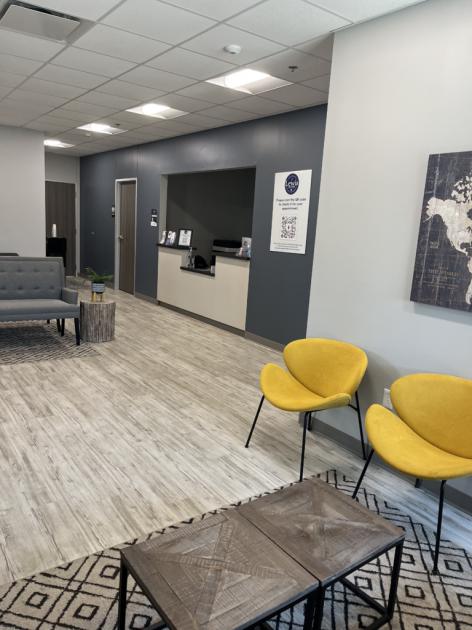
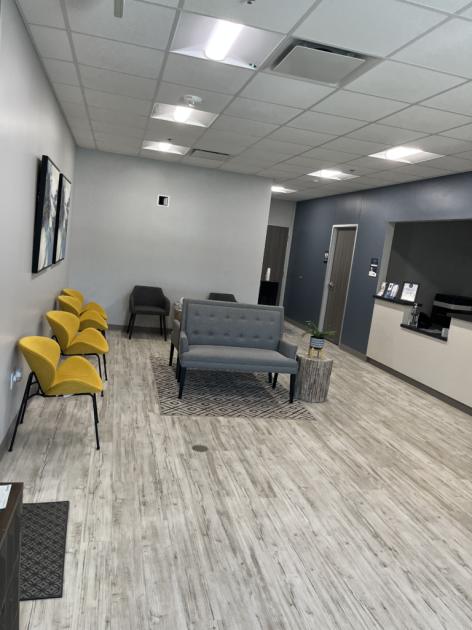
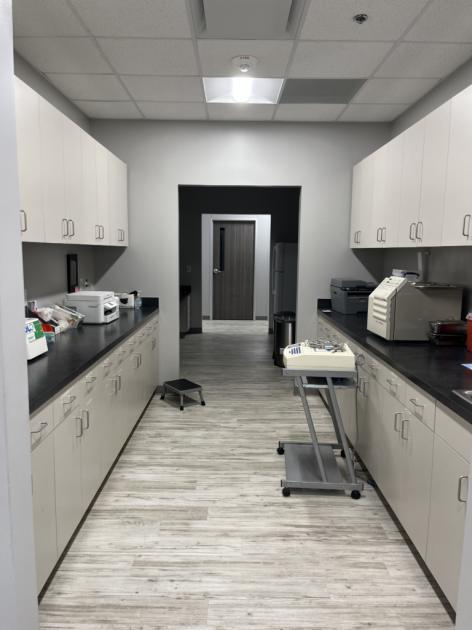
• This rare opportunity for turnkey-ready medical real estate in a high-growth area with low vacancy
Additional Photos
Listing Agents

Ryan Frey
M: 214-450-8645
rfrey@practicerealestategroup.com
M: 214-450-8645
rfrey@practicerealestategroup.com
While we strive to provide the most accurate information, all listing information, and demographic data, is provided by third-parties. As such, MyEListing will not be responsible for the accuracy of the information. It is strongly recommended that you verify all information with the listing agent, and any relevant agencies, prior to making any decisions.