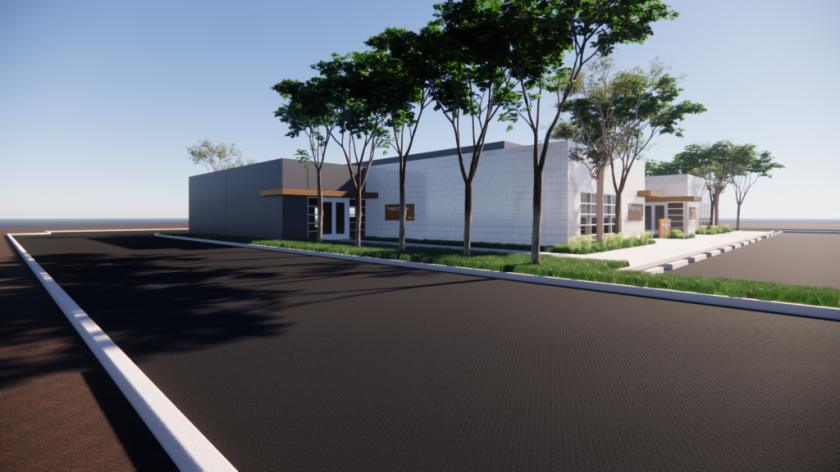
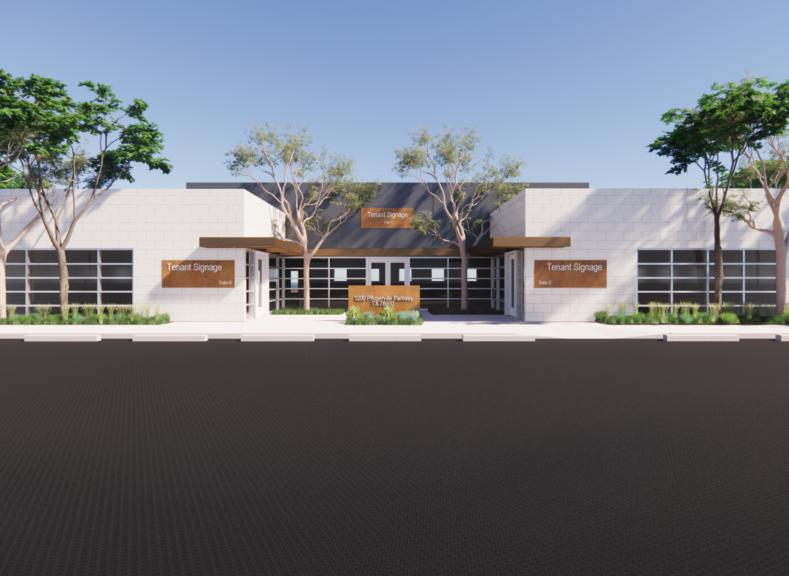
Office Space
1200 East Pflugerville Parkway Pflugerville, TX 78660
1200 East Pflugerville Parkway Pflugerville, TX 78660
Details & Description
Property Highlights
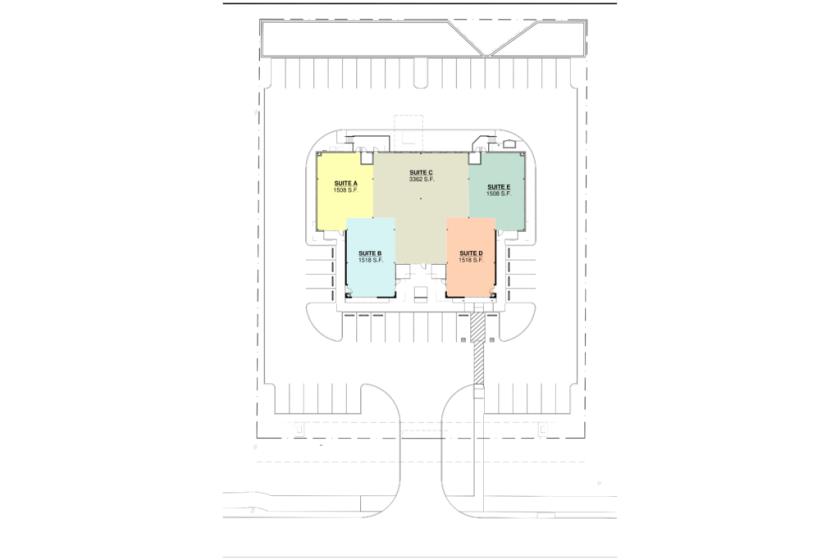
- • Total Building Size: 9,414 SF
- • Medical office space in the heart of Pflugerville
- • No. Units: 2+
- • Condition: Shell
- • Delivery: March 2024
Listing Agents

Macie Morris
M: 940-733-3424
macie@practicerealestategroup.com
M: 940-733-3424
macie@practicerealestategroup.com
While we strive to provide the most accurate information, all listing information, and demographic data, is provided by third-parties. As such, MyEListing will not be responsible for the accuracy of the information. It is strongly recommended that you verify all information with the listing agent, and any relevant agencies, prior to making any decisions.