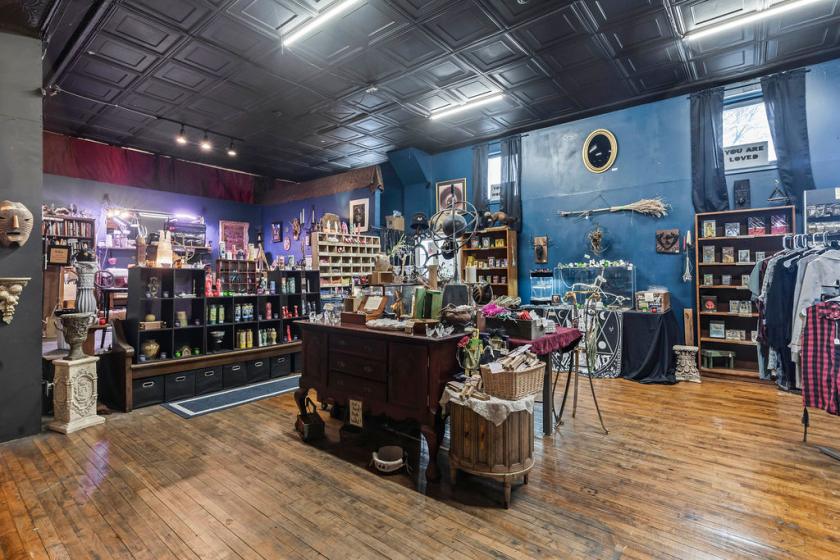
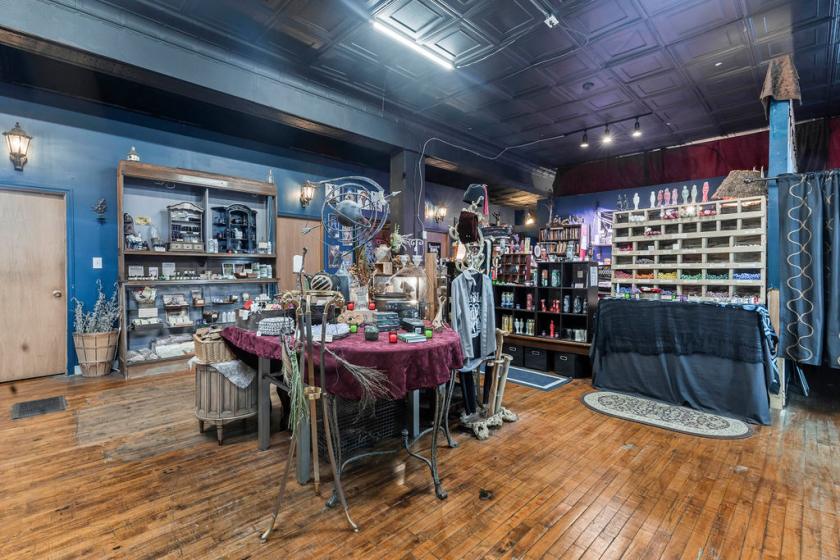
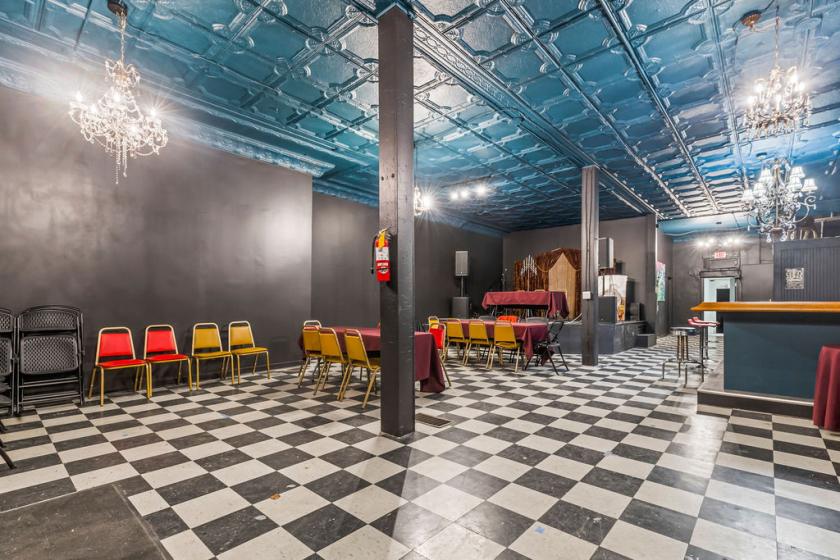
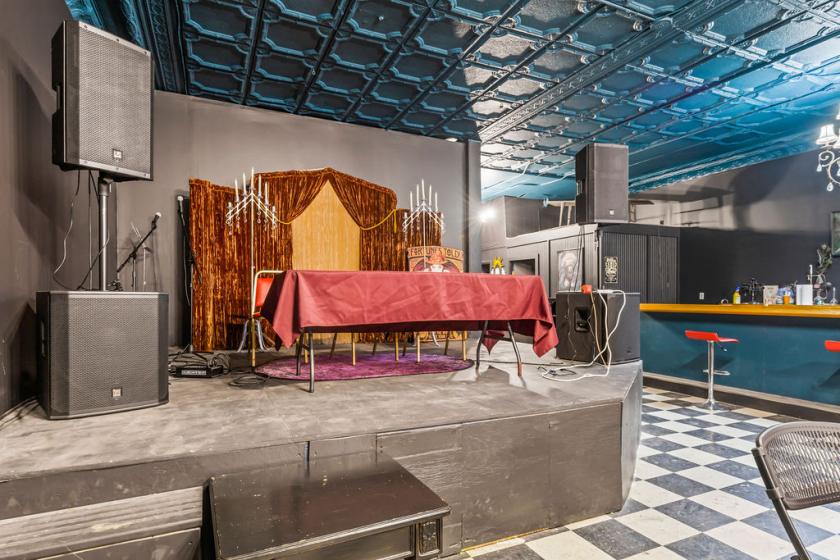
Retail Space
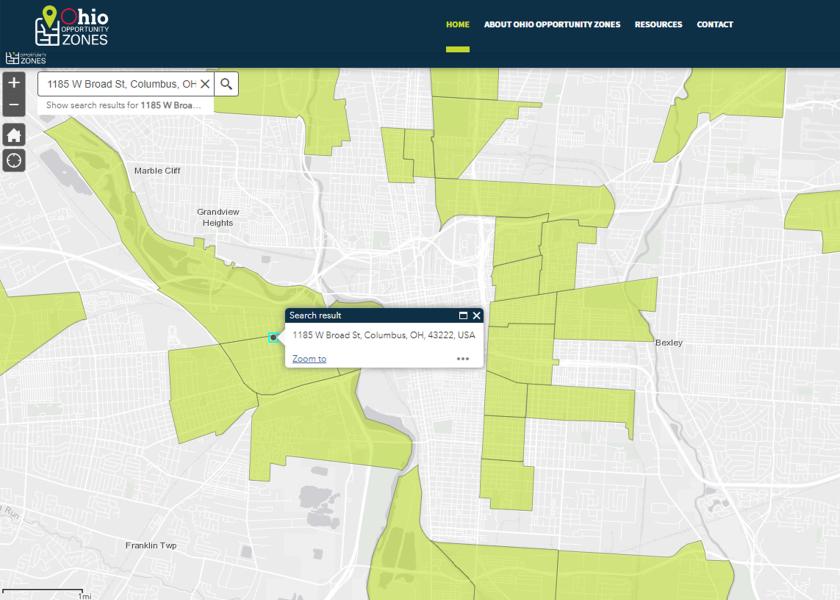
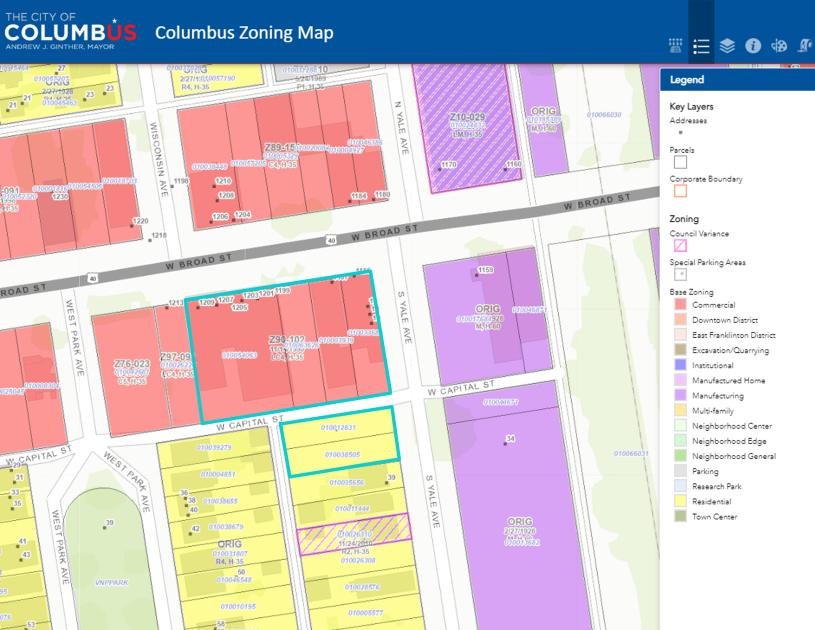
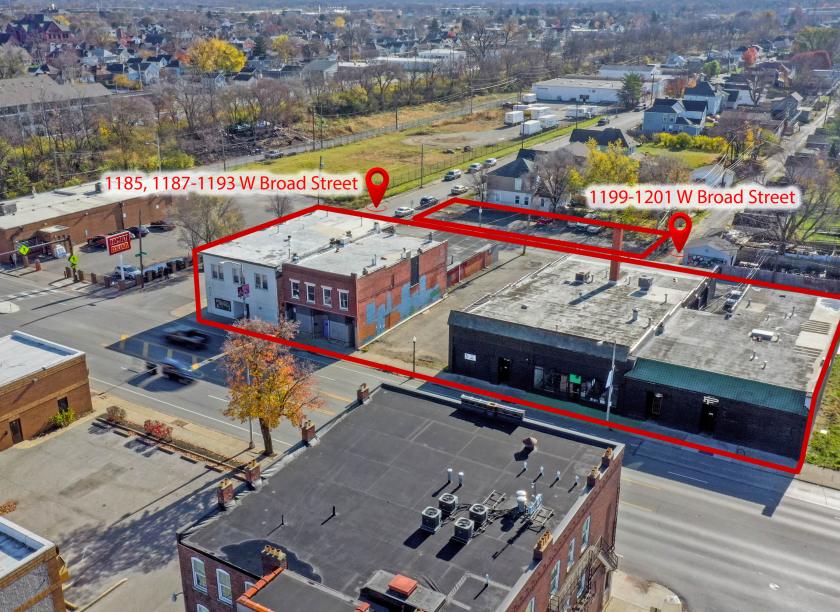
1185 West Broad Street Columbus, OH 43222
1185 West Broad Street Columbus, OH 43222
Details & Description
Property Highlights
- • 100% leased
- • Cap Rate 7.0%
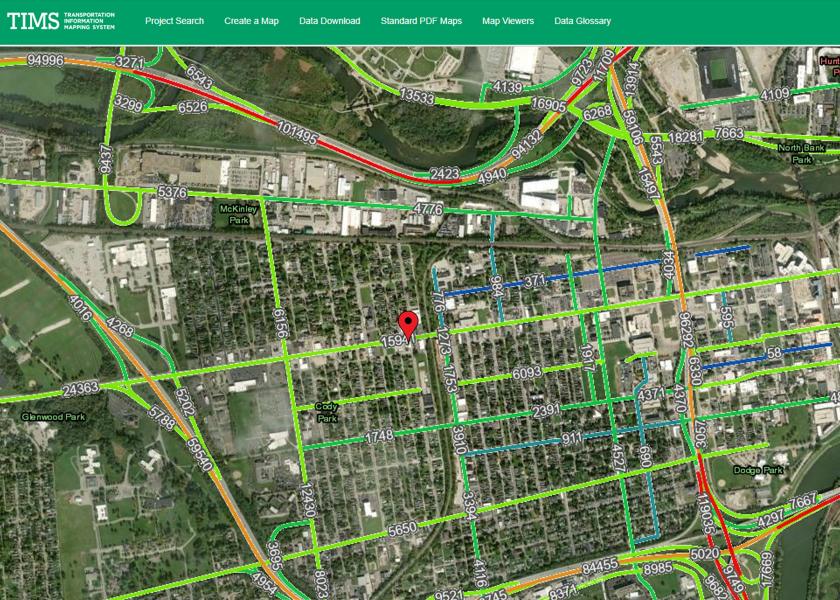
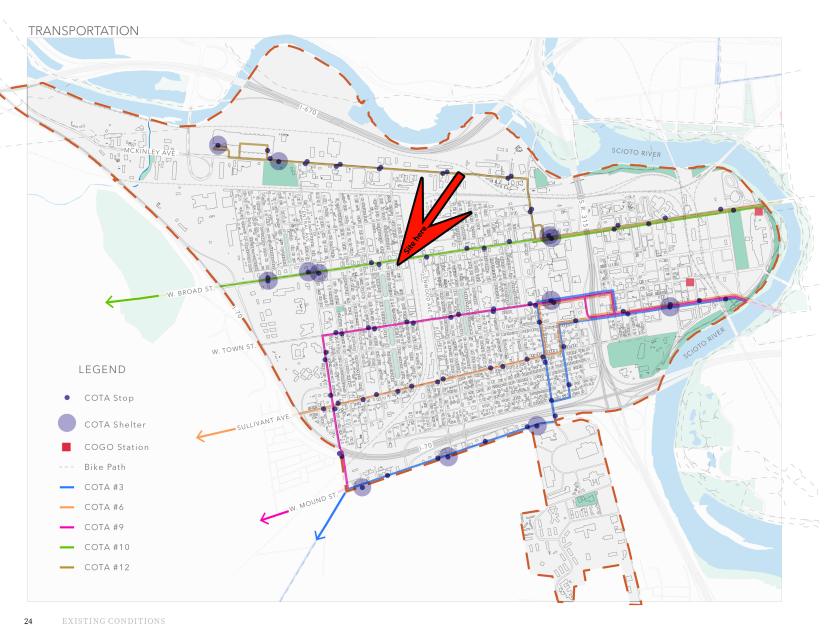
- • Easy access to Downtown
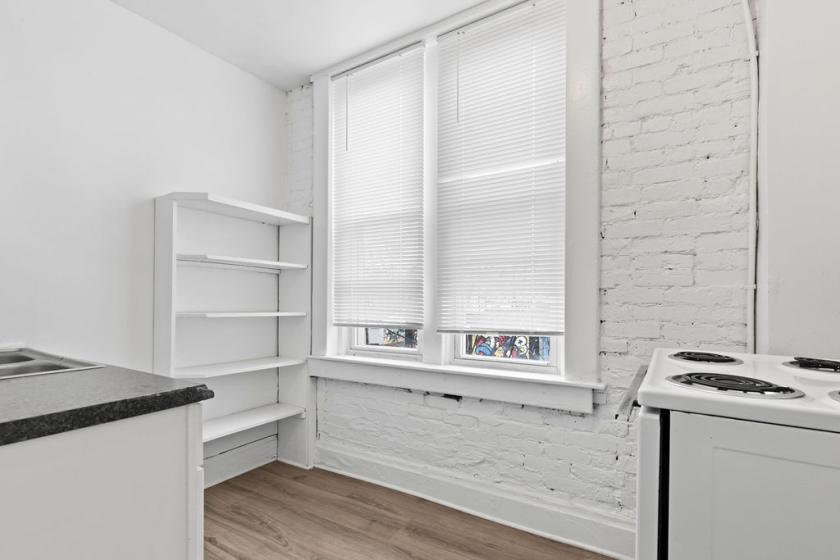
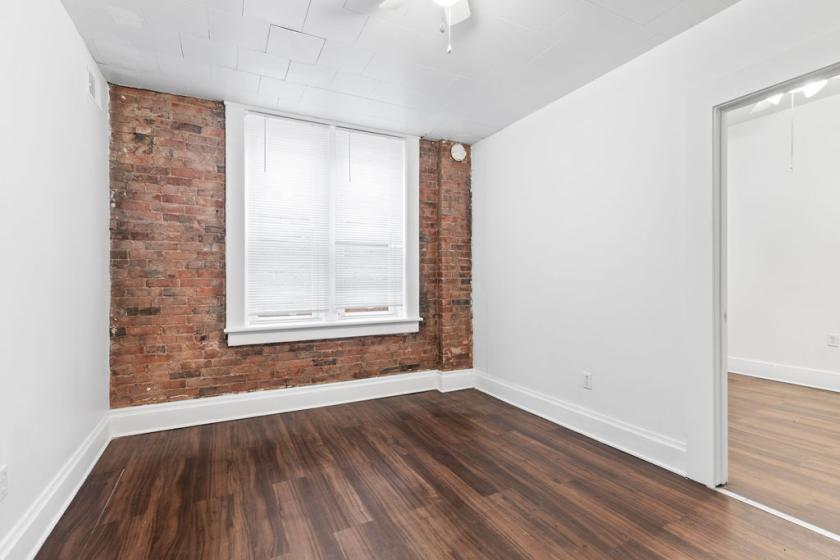
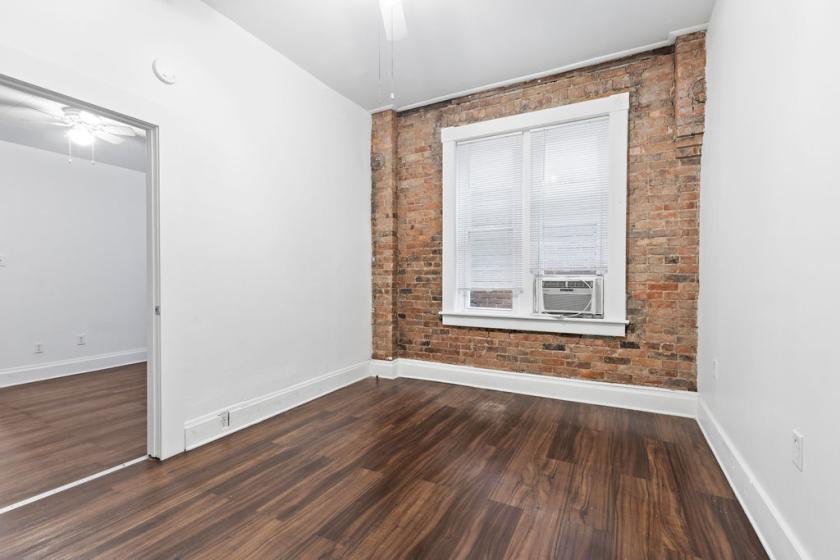
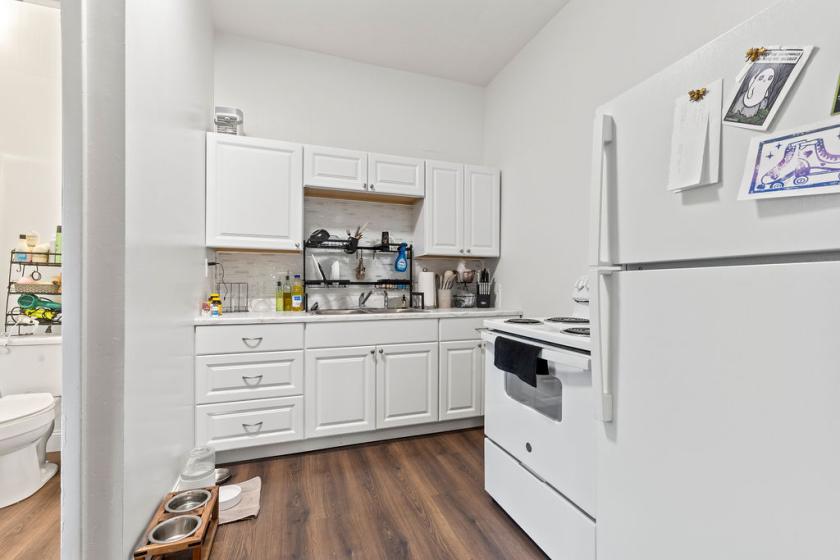
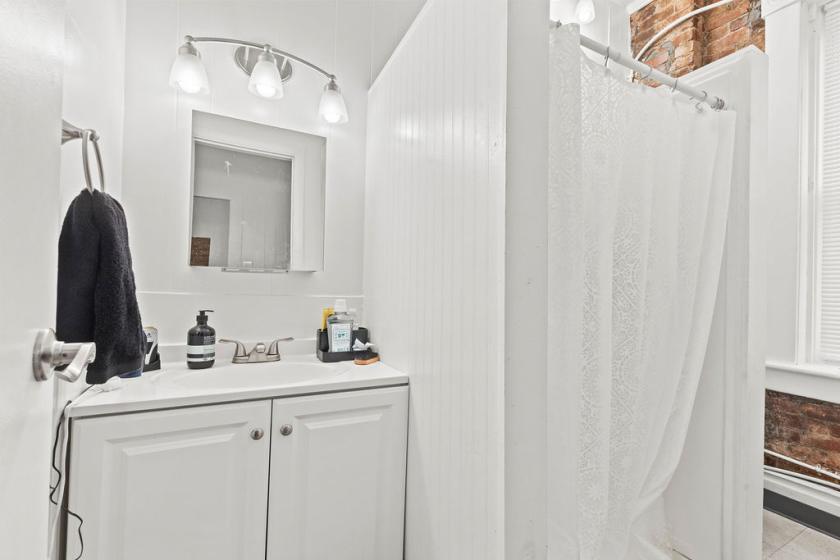
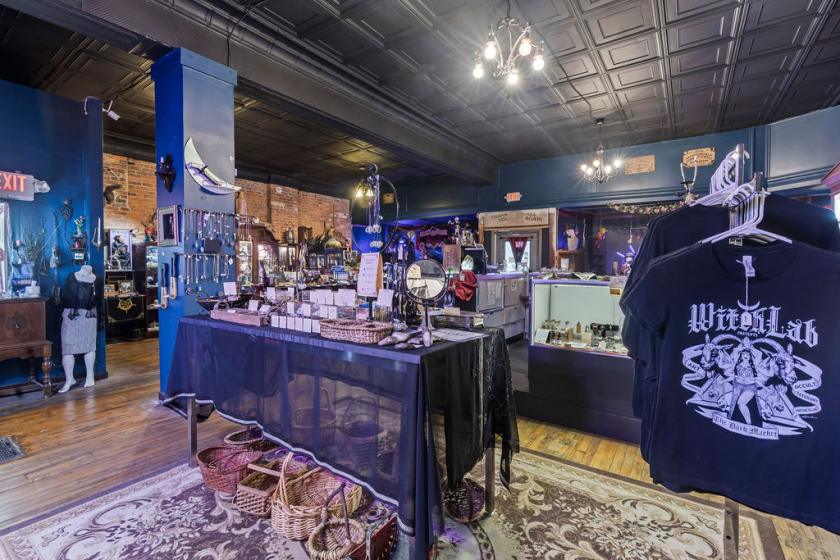
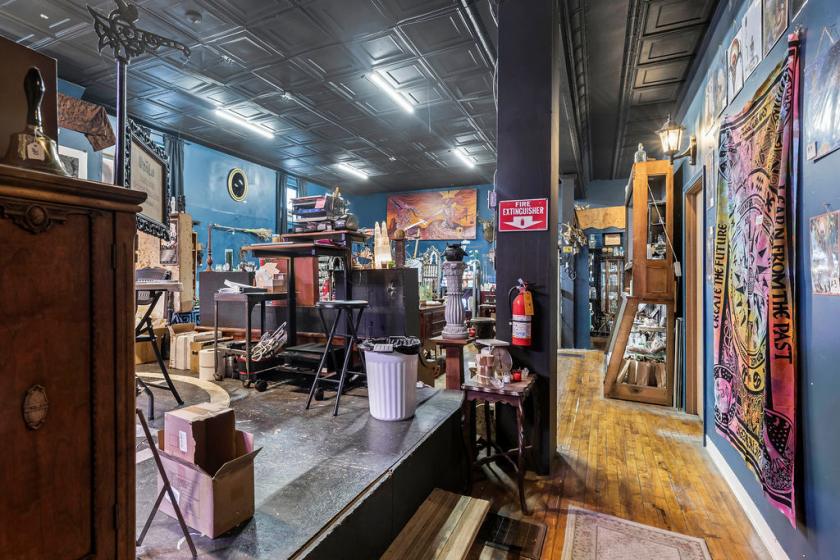
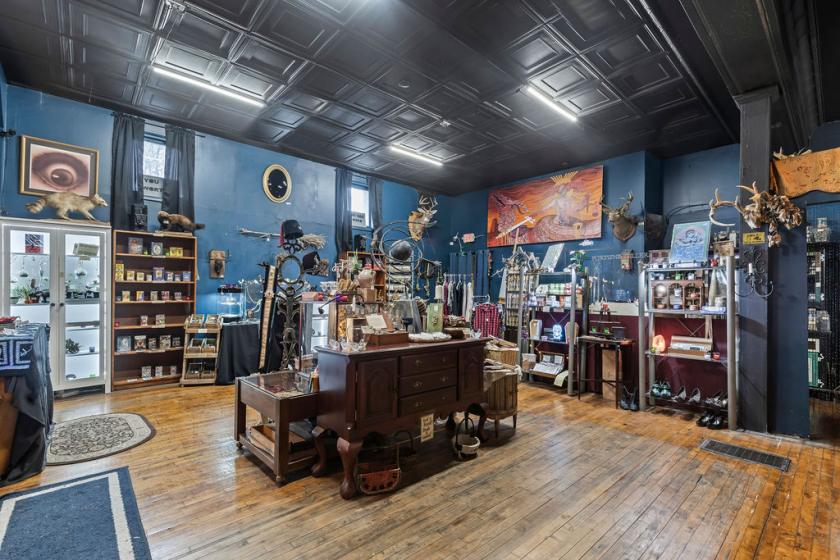
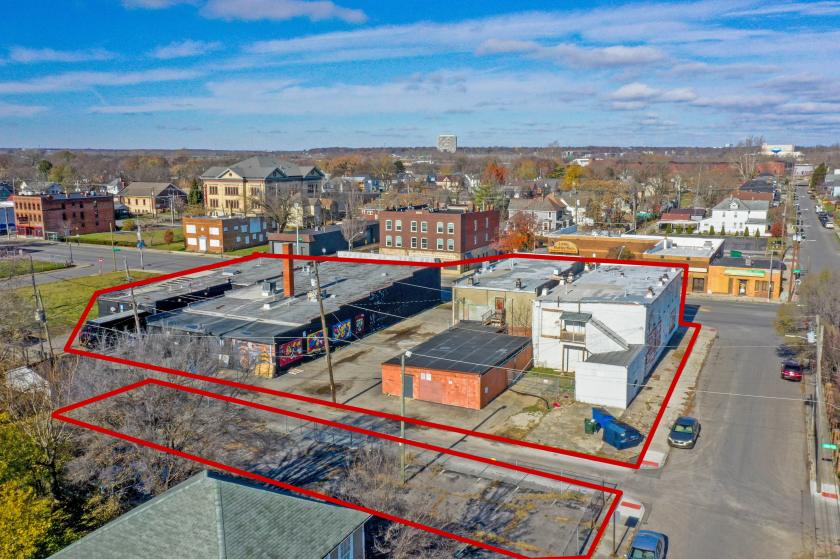
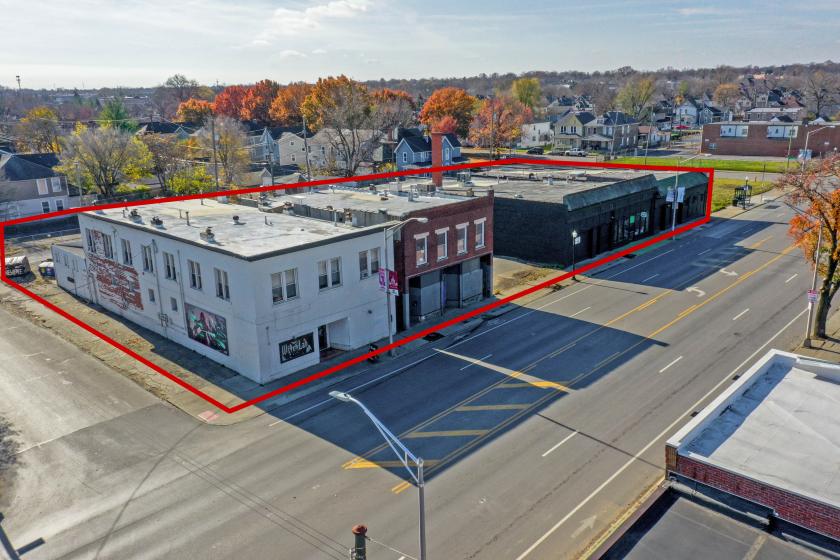
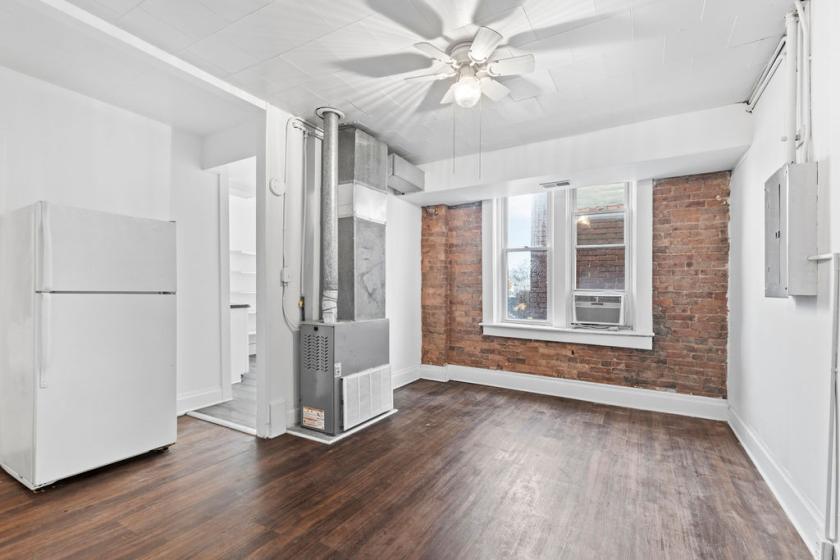
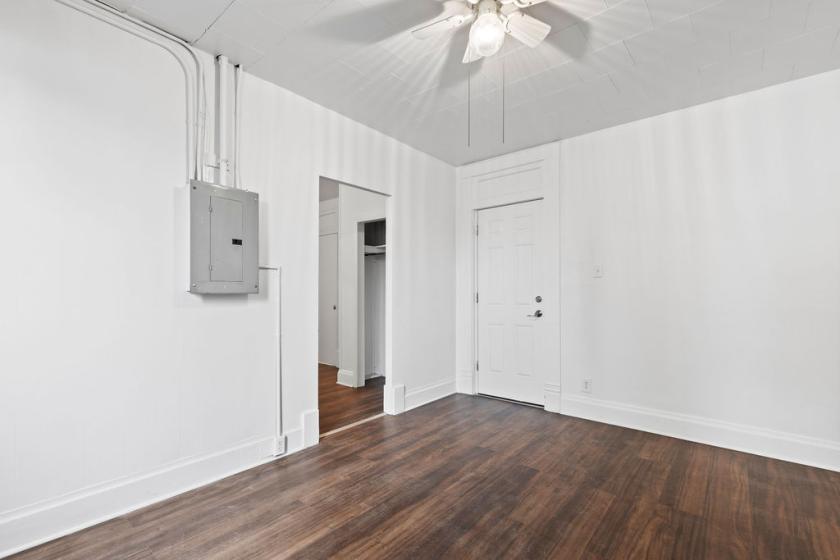
Additional Photos
Listing Agents

Alex Marsh
O: 614-245-2182
M: 614-937-3658
amarsh@rweiler.com
O: 614-245-2182
M: 614-937-3658
amarsh@rweiler.com
While we strive to provide the most accurate information, all listing information, and demographic data, is provided by third-parties. As such, MyEListing will not be responsible for the accuracy of the information. It is strongly recommended that you verify all information with the listing agent, and any relevant agencies, prior to making any decisions.