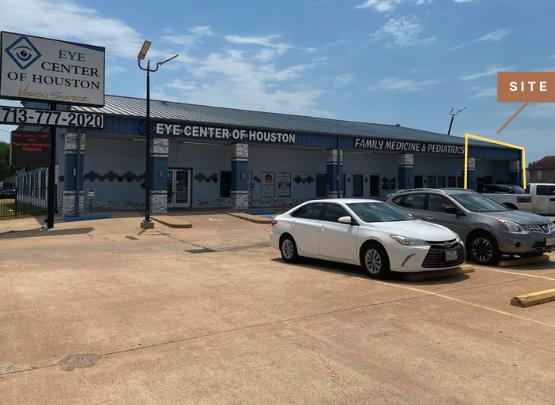
Office Space
10101 Bissonnet Street Houston, TX 77036
10101 Bissonnet Street Houston, TX 77036
Details & Description
Property Highlights
• Convenient access to major Houston roadways, including Beltway 8 and I-69
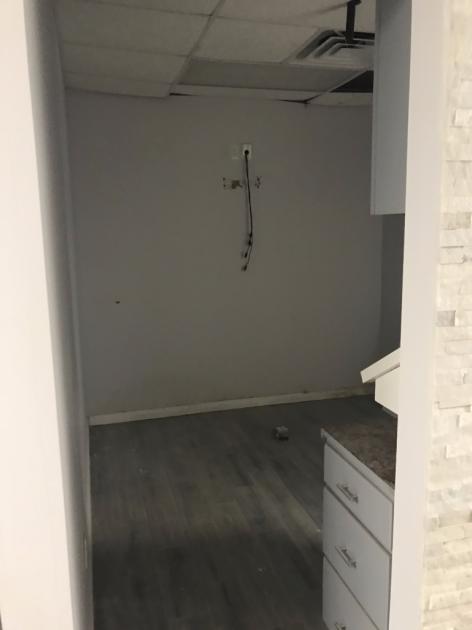
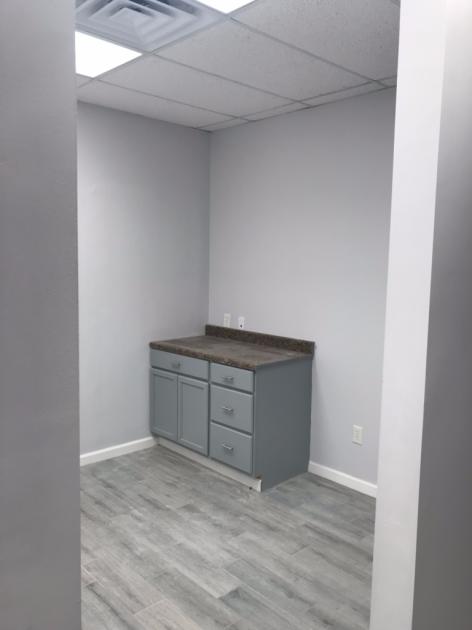
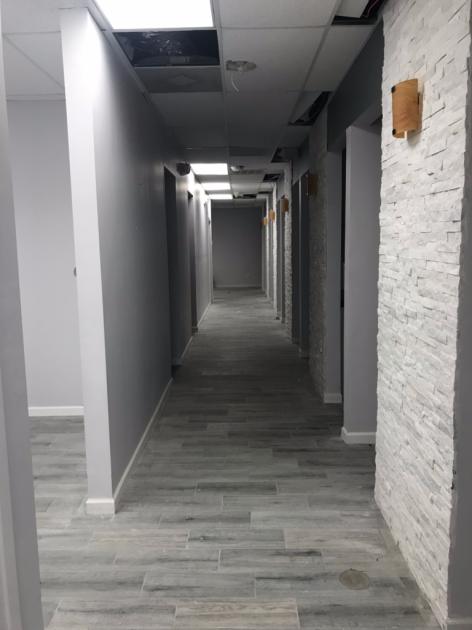
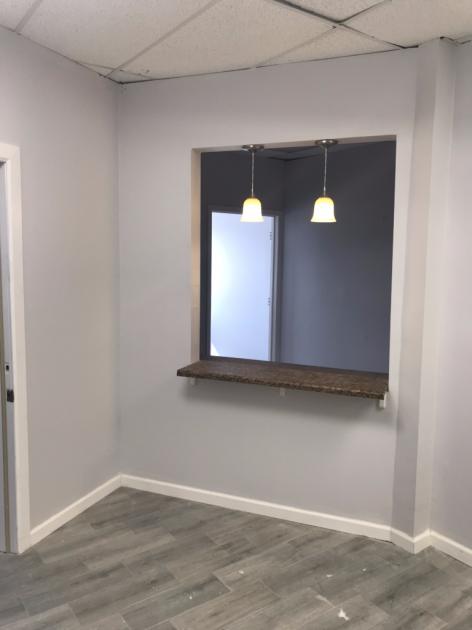
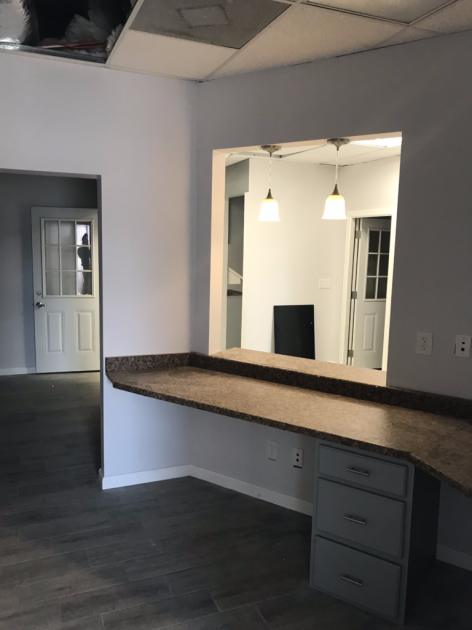
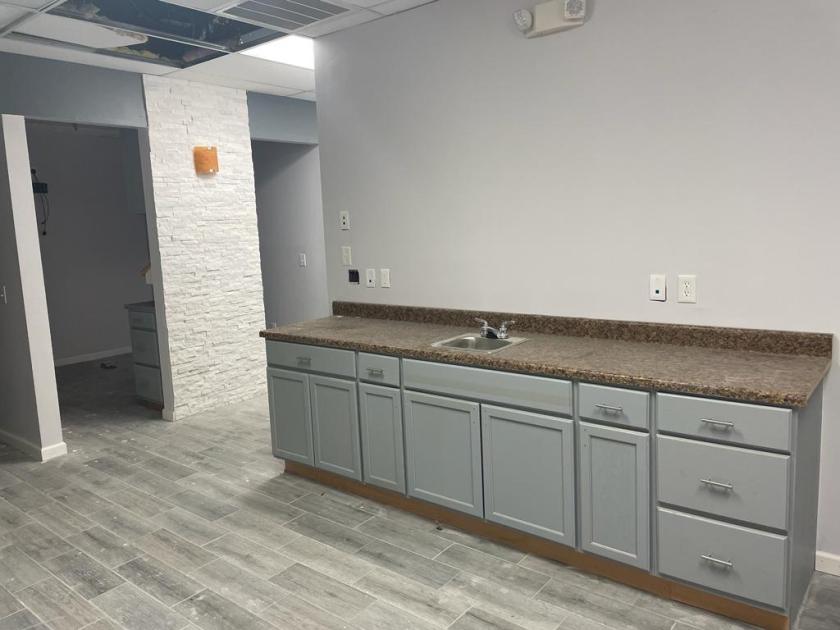
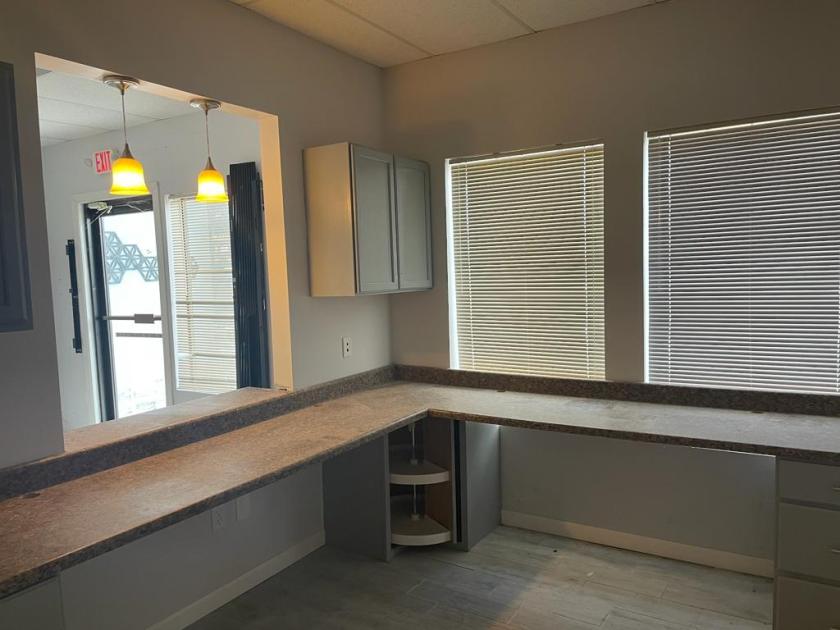
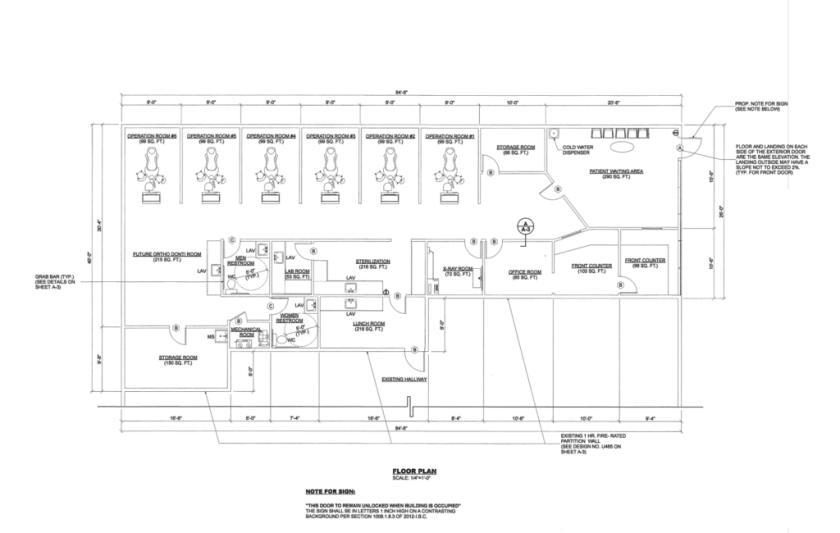
• 2,624 SF first-generation dental suite located in Beltway Medical Plaza
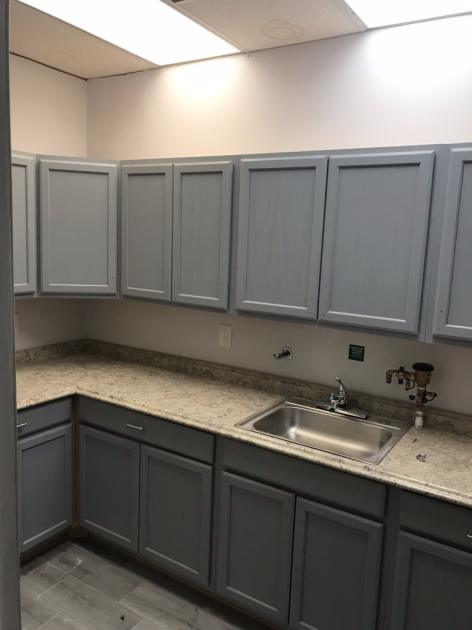
Additional Photos
Listing Agents

James Fitzgerald
M: 210-872-4800
jfitzgerald@practicerealestategroup.com
M: 210-872-4800
jfitzgerald@practicerealestategroup.com
While we strive to provide the most accurate information, all listing information, and demographic data, is provided by third-parties. As such, MyEListing will not be responsible for the accuracy of the information. It is strongly recommended that you verify all information with the listing agent, and any relevant agencies, prior to making any decisions.