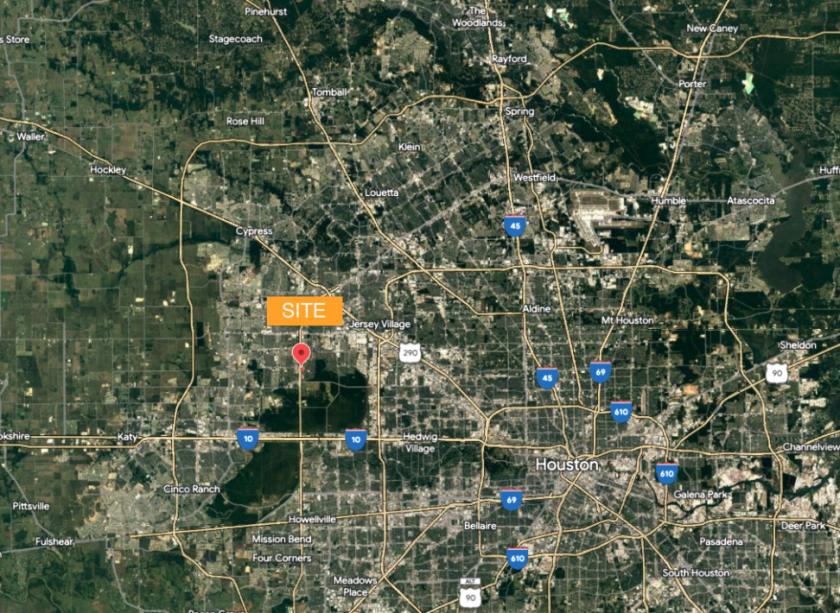
Commercial Land
Kieth Harrow Blvd Houston, TX 77084
Kieth Harrow Blvd Houston, TX 77084
Details & Description
Property Highlights
- • High growth area
- • Dense residential and commercial surroundings
- • Prime access to Highway 6, Highway 290, and I-10
- • Shadow anchored by H-E-B and Walmart
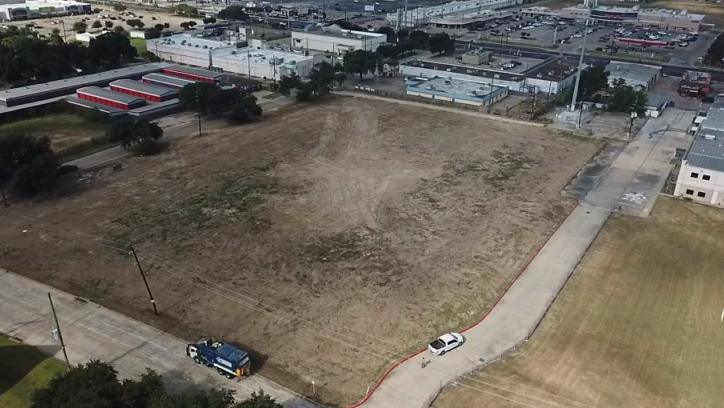
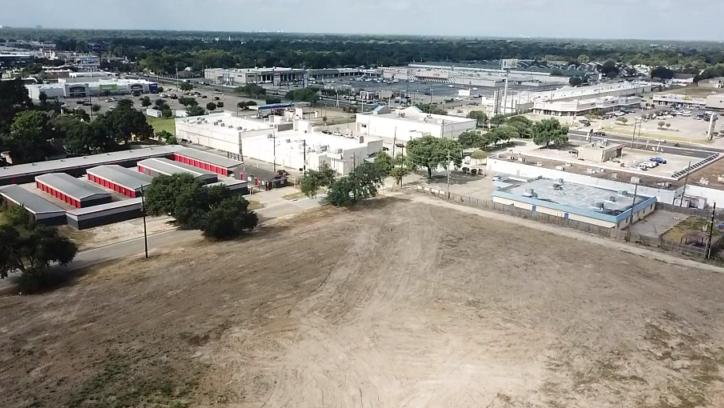
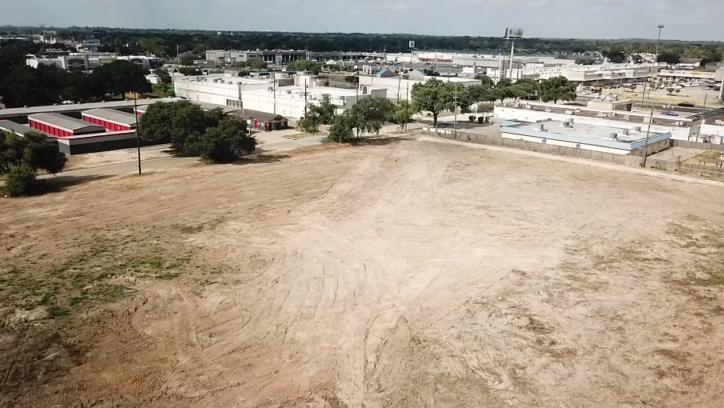
- • Vacant site
- • Commercial Land
Additional Photos
Listing Agents

James Fitzgerald
M: 210-872-4800
jfitzgerald@practicerealestategroup.com
M: 210-872-4800
jfitzgerald@practicerealestategroup.com
While we strive to provide the most accurate information, all listing information, and demographic data, is provided by third-parties. As such, MyEListing will not be responsible for the accuracy of the information. It is strongly recommended that you verify all information with the listing agent, and any relevant agencies, prior to making any decisions.


