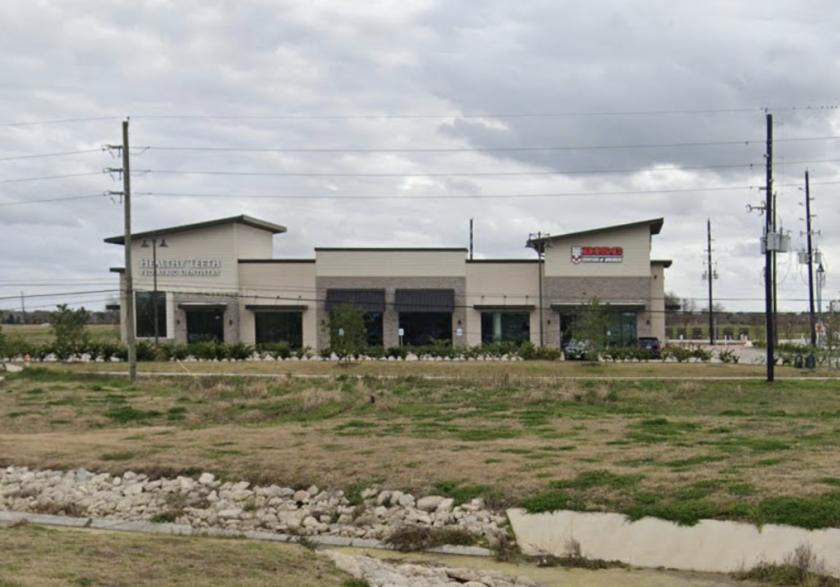
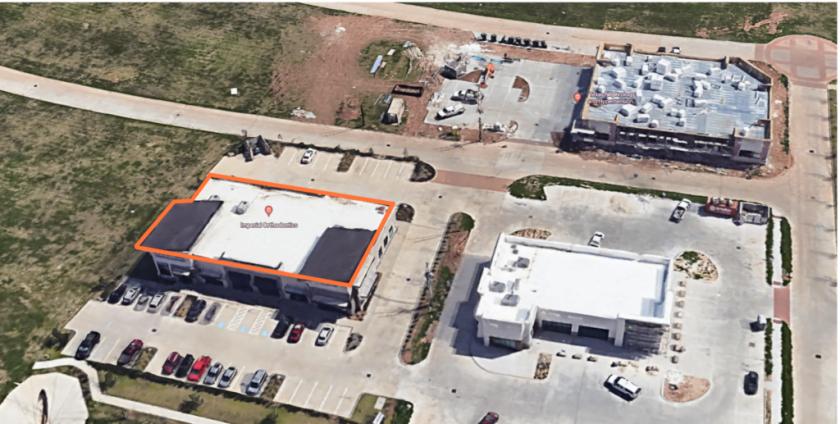
1-Mile | 3-Miles | 5-Miles | ||
---|---|---|---|---|
Total Population | 6,894 | 83,171 | 228,673 | |
Population Median Age | 37 | 38 | 38 | |
Population by Age | 0-9 Yrs | 914 (13%) | 10074 (12%) | 28244 (12%) |
10-19 Yrs | 1023 (14%) | 12105 (14%) | 31586 (13%) | |
20-29 Yrs | 741 (10%) | 11734 (14%) | 30862 (13%) | |
30-39 Yrs | 843 (12%) | 9901 (11%) | 29067 (12%) | |
40-49 Yrs | 1514 (21%) | 12397 (14%) | 32533 (14%) | |
50-59 Yrs | 577 (8%) | 10241 (12%) | 30615 (13%) | |
60-69 Yrs | 867 (12%) | 10185 (12%) | 27692 (12%) | |
70+ Yrs | 415 (6%) | 6535 (7%) | 18073 (7%) | |
Median HH Income | $140,759 | $107,924 | $100,595 | |
Total Household Income | < 24K | 191 (9%) | 2175 (8%) | 6182 (8%) |
25-49K | 238 (11%) | 3133 (11%) | 9793 (13%) | |
50-74K | 187 (8%) | 3797 (14%) | 11309 (15%) | |
75-99K | 181 (8%) | 3205 (12%) | 8672 (11%) | |
100-199K | 564 (26%) | 8422 (32%) | 23632 (32%) | |
200K+ | 734 (35%) | 5581 (21%) | 12688 (17%) | |
Highest Education Level | No Diploma | 354 | 3919 | 13428 |
Diploma or GED | 843 | 8201 | 25487 | |
Some College | 458 | 9595 | 26335 | |
Assoc. Degree | 205 | 3562 | 10622 | |
Bachelors Degree | 1245 | 16457 | 46610 | |
Higher Degree | 1505 | 13819 | 31256 | |
Total Housing Units | 2,221 | 27,705 | 75,505 | |
--Owner-Occupied | 1,491 | 19,309 | 53,876 | |
--Renter-Occupied | 604 | 7,003 | 18,399 | |
Owner-Occupied Values | < 100K | 24 | 446 | 1842 |
100-199K | 43 | 2917 | 10166 | |
200-299K | 198 | 5801 | 17039 | |
300-399K | 275 | 4013 | 11996 | |
400-499K | 313 | 2919 | 6421 | |
500K+ | 639 | 3214 | 6411 | |
Total Working Age Population | 5,403 | 65,433 | 180,456 | |
In Work Force | 3,580 | 42,898 | 119,063 | |
Not In Work Force | 1,823 | 22,534 | 61,393 | |
Workforce Employed | 3,427 | 40,505 | 112,662 | |
Workforce Unemployed | 153 | 2,363 | 6,324 | |
Civlian Workforce | 3,580 | 42,867 | 118,986 | |
Military Workforce | 0 | 31 | 77 | |
Total Households | 2,095 | 26,313 | 72,275 | |
Family Households | 1,702 | 20,618 | 58,014 | |
Non-Family Households | 393 | 5,695 | 14,261 | |
Married Couple | 1,471 | 17,429 | 48,031 | |
Other Family | 231 | 3,189 | 9,983 | |
Married w/Child | 773 | 8,460 | 22,285 | |
Single Male w/Child | 2 | 230 | 984 | |
Single Female w/Child | 71 | 1,092 | 3,684 |
Population Change Last Two Decades - Plus Projection
2000 | % | 2010 | % | 2020 | % | 2030 | |
---|---|---|---|---|---|---|---|
Texas | 20,851,820 | +21 | 25,145,561 | +18 | 29,677,668 | +18 | 34,894,452 |
Fort Bend County | 354,452 | +65 | 585,375 | +44 | 840,383 | +43 | 1,203,029 |
Harris County | 3,400,578 | +20 | 4,092,459 | +22 | 4,978,845 | +19 | 5,924,750 |
Total Working Age Population:
Total Households:
Total Working Age Population:
Total Households:
Total Working Age Population:
Total Households: