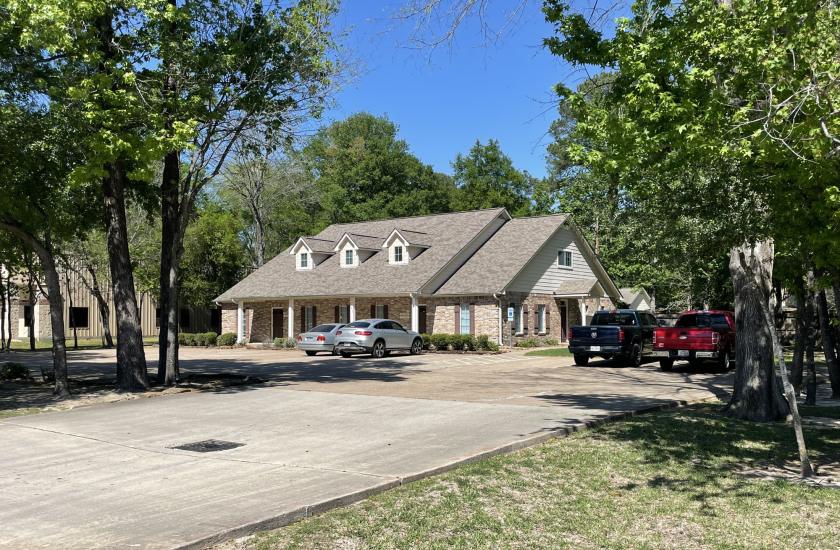
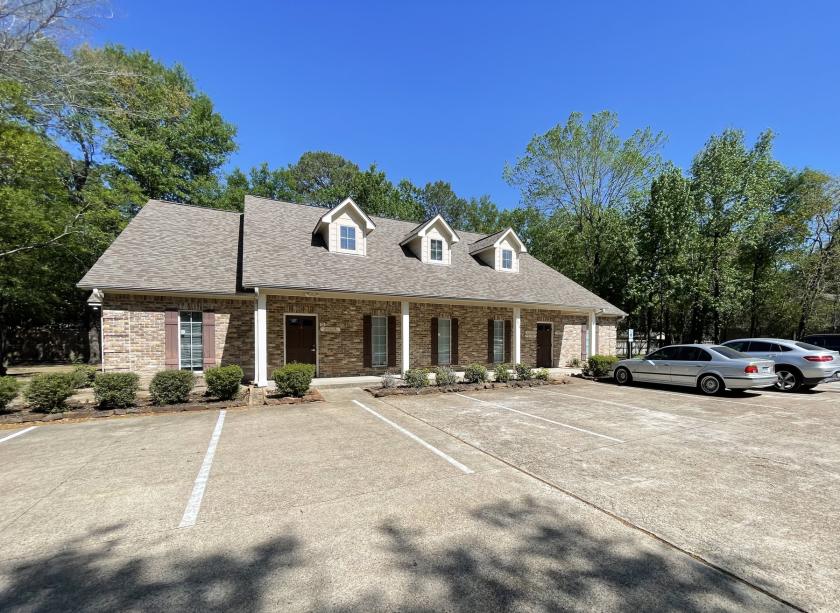
Office Space
17018 Seven Pines Drive Spring, TX 77379
17018 Seven Pines Drive Spring, TX 77379
Details & Description
Property Highlights
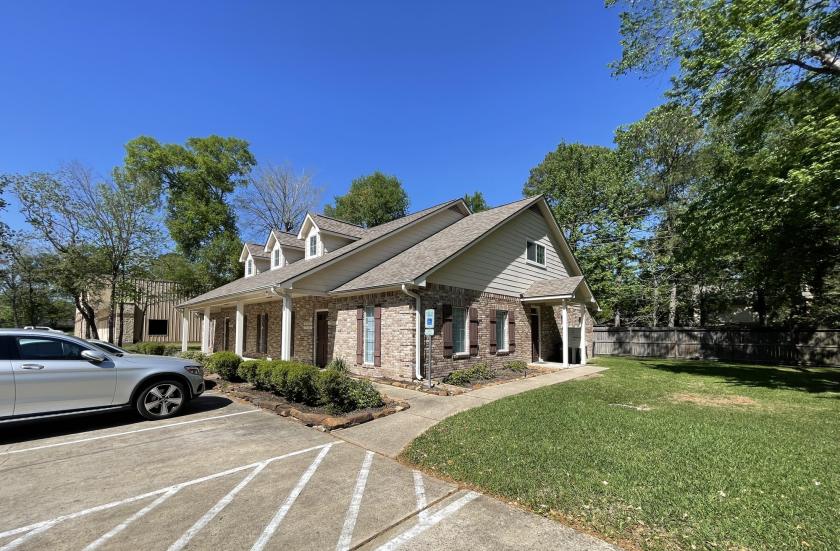
• Located only 700 feet north of Louetta Road, between Stuebner Airline Road and TC Jester Boulevard
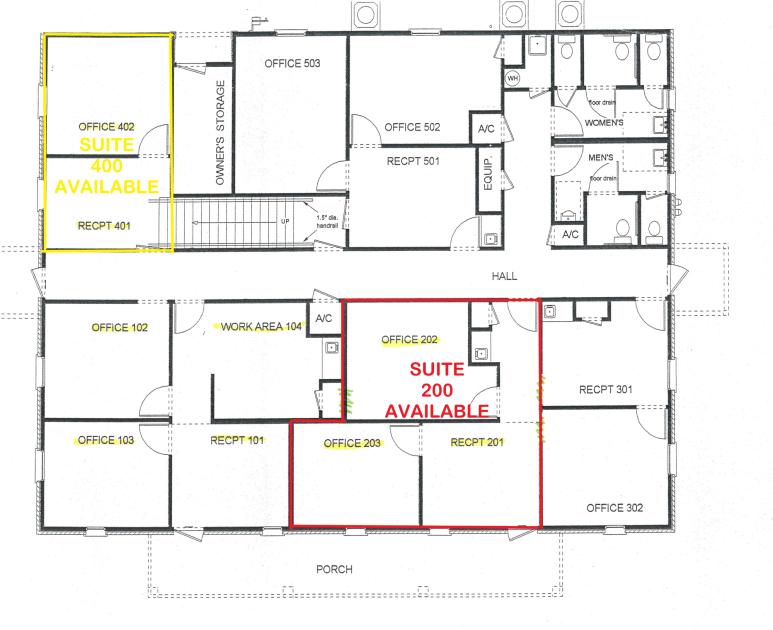
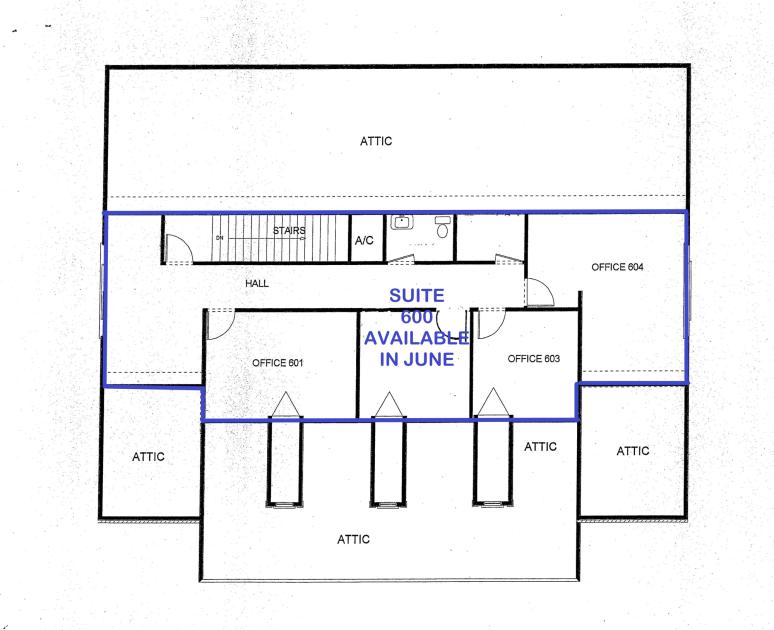
• One first floor suite and entire second floor available immediately
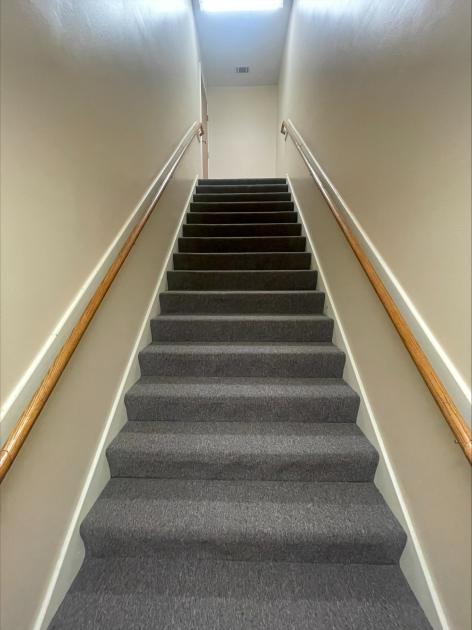
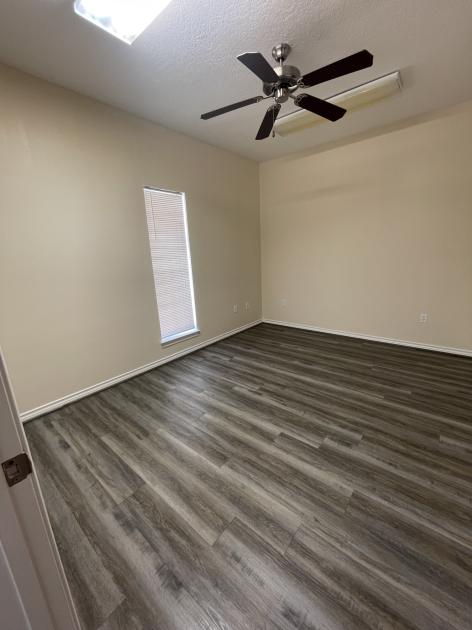
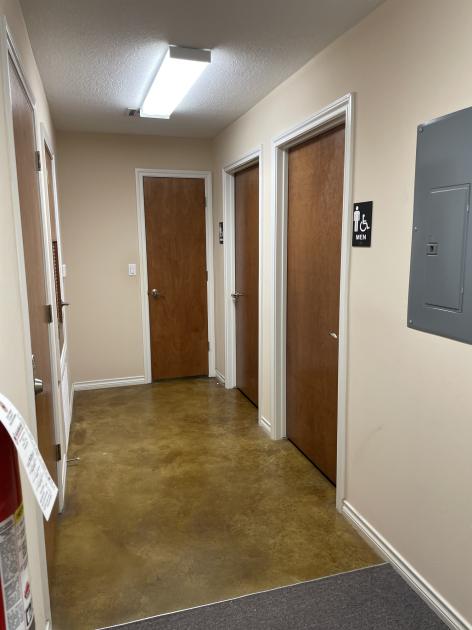
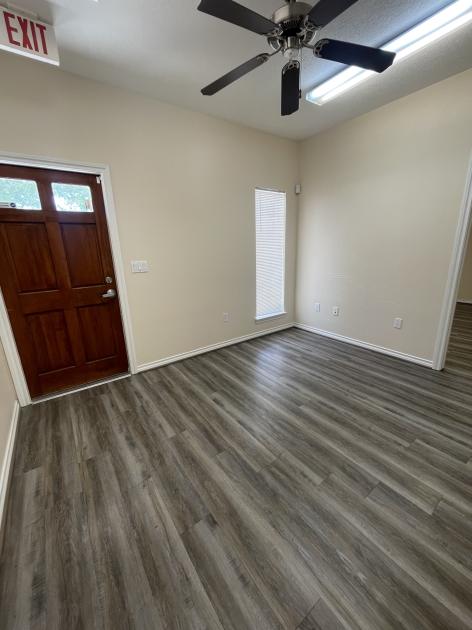
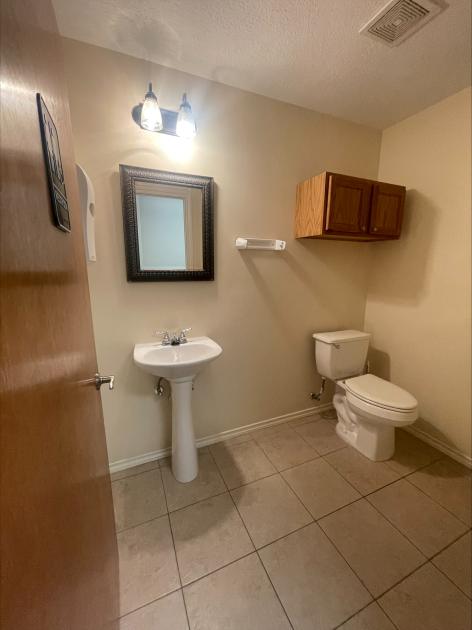
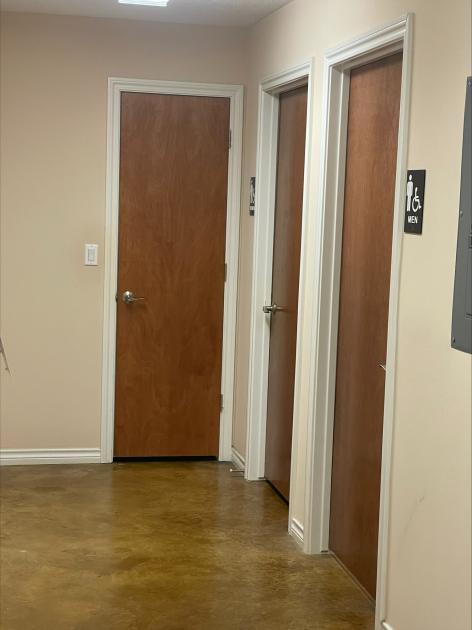
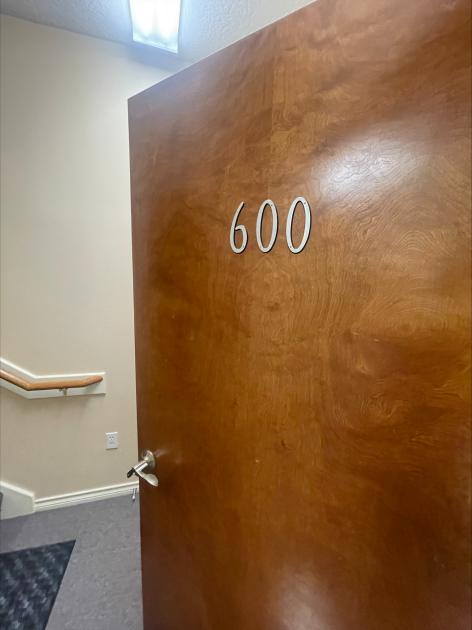
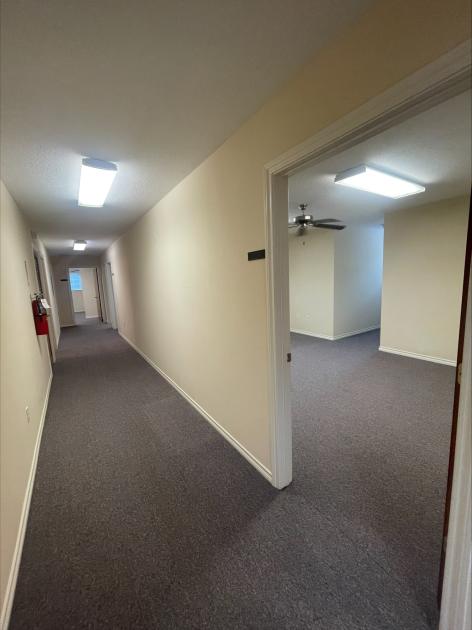
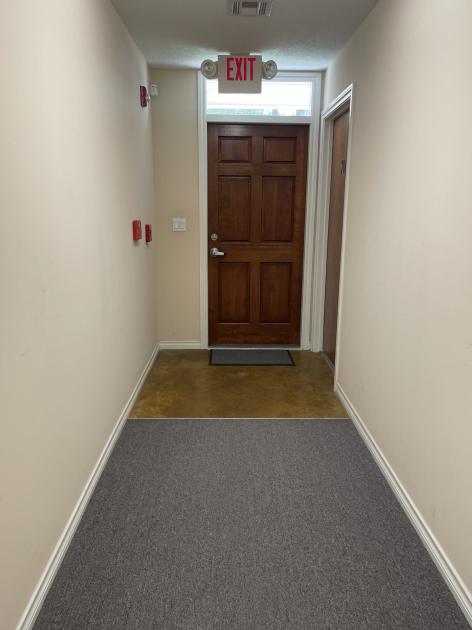
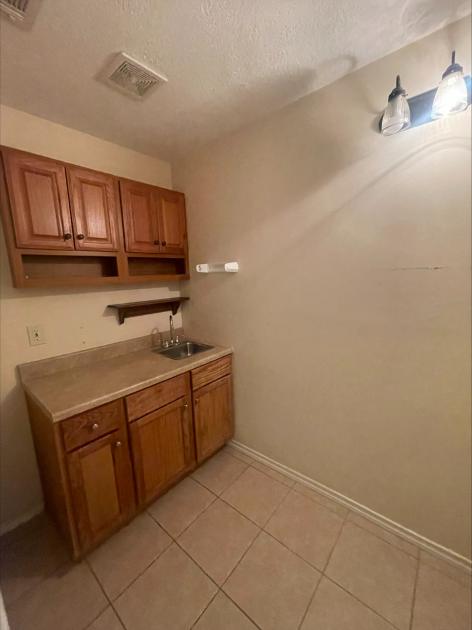
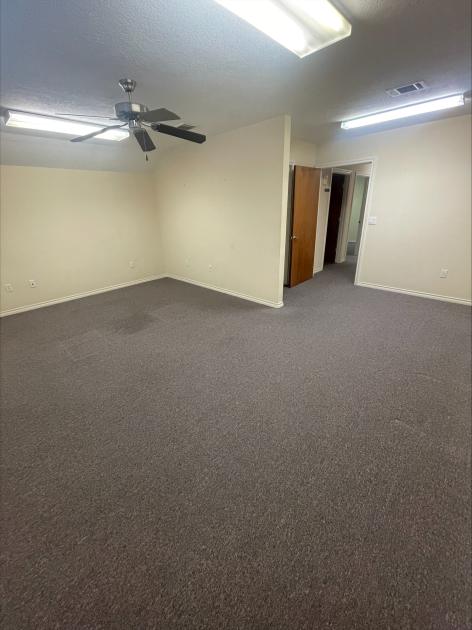
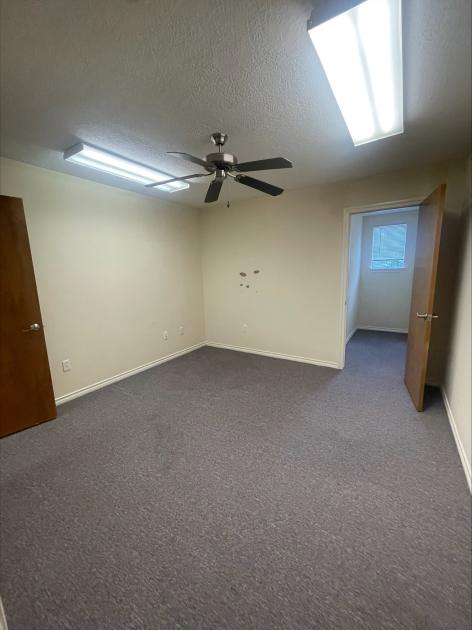
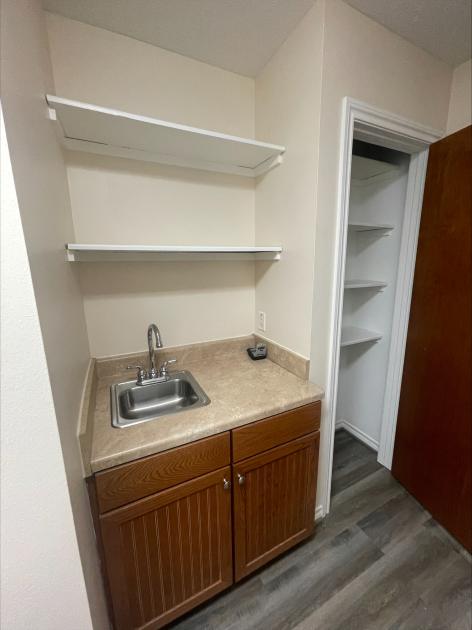
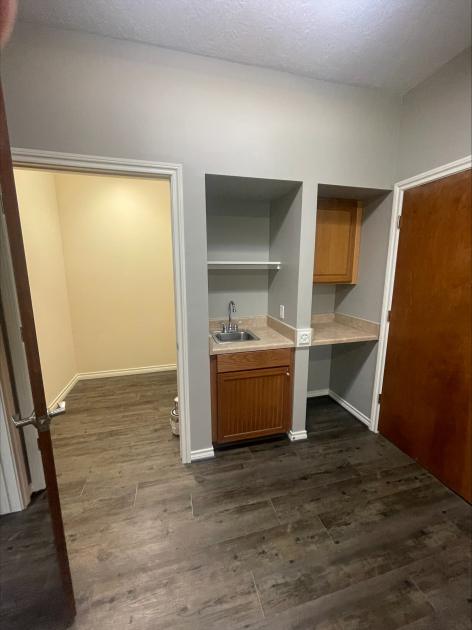
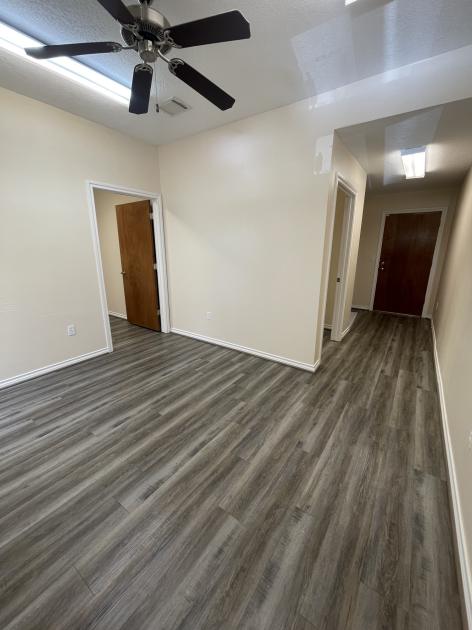
Additional Photos
Listing Agents

Tyler Torres
O: 713-473-7200
M: 281-898-0895
tyler@texascres.com
O: 713-473-7200
M: 281-898-0895
tyler@texascres.com
While we strive to provide the most accurate information, all listing information, and demographic data, is provided by third-parties. As such, MyEListing will not be responsible for the accuracy of the information. It is strongly recommended that you verify all information with the listing agent, and any relevant agencies, prior to making any decisions.