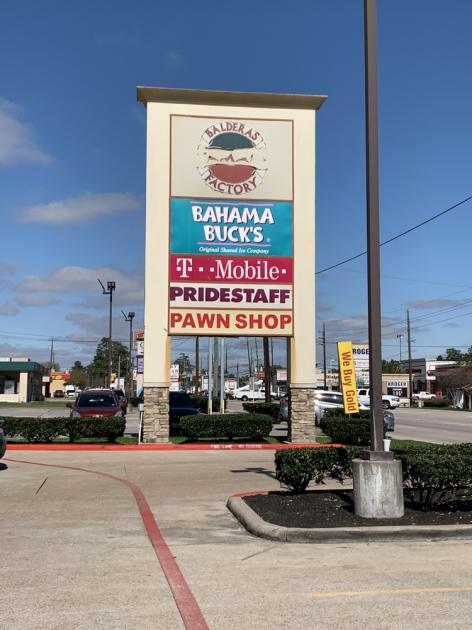
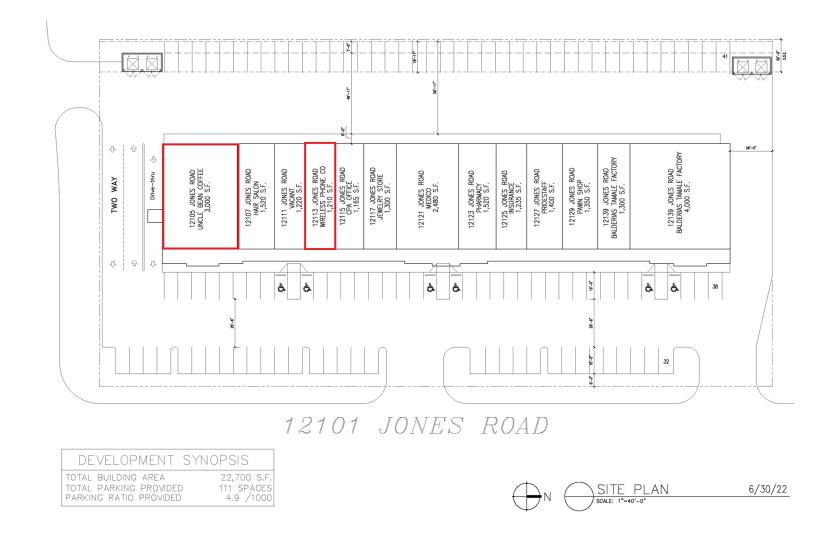
Retail Space
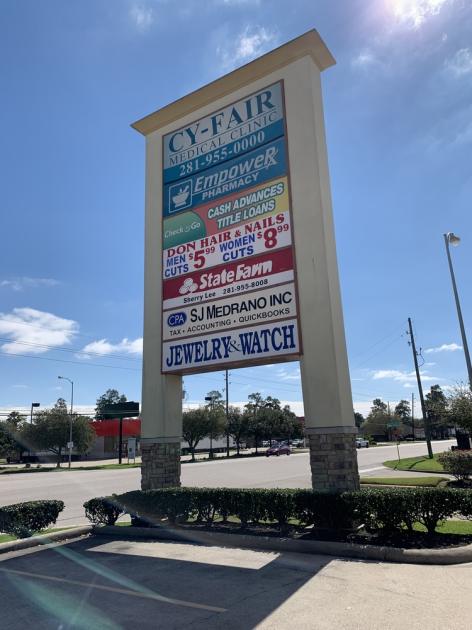
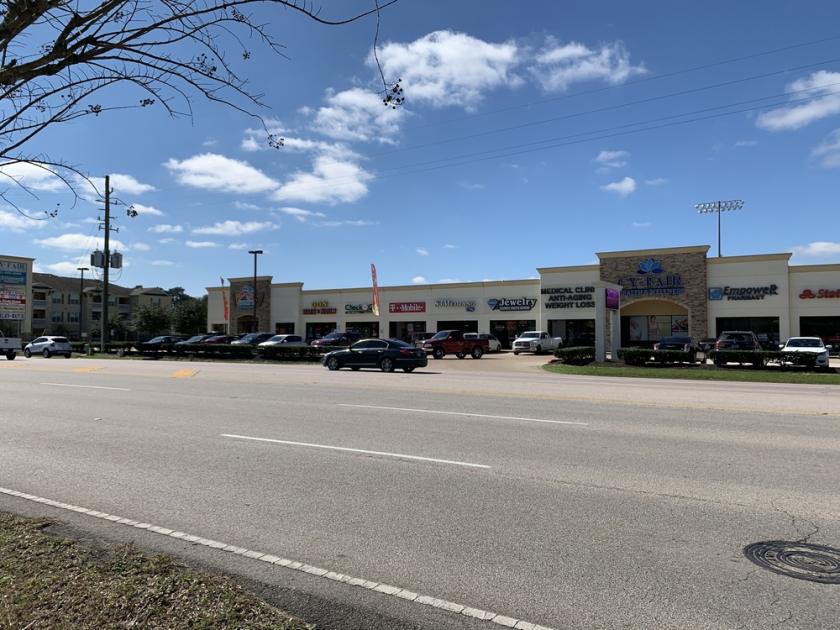
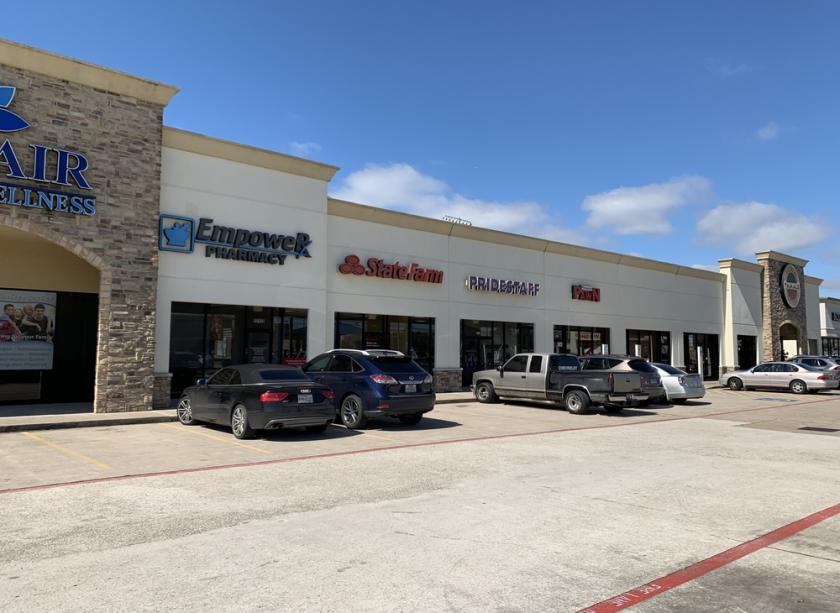
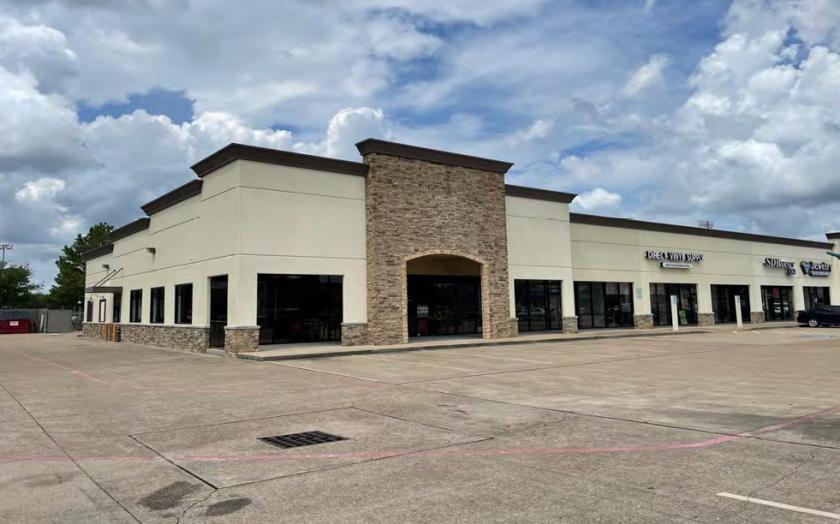
12105 and 12123 Jones Rd Houston, TX 77070
12105 and 12123 Jones Rd Houston, TX 77070
Details & Description
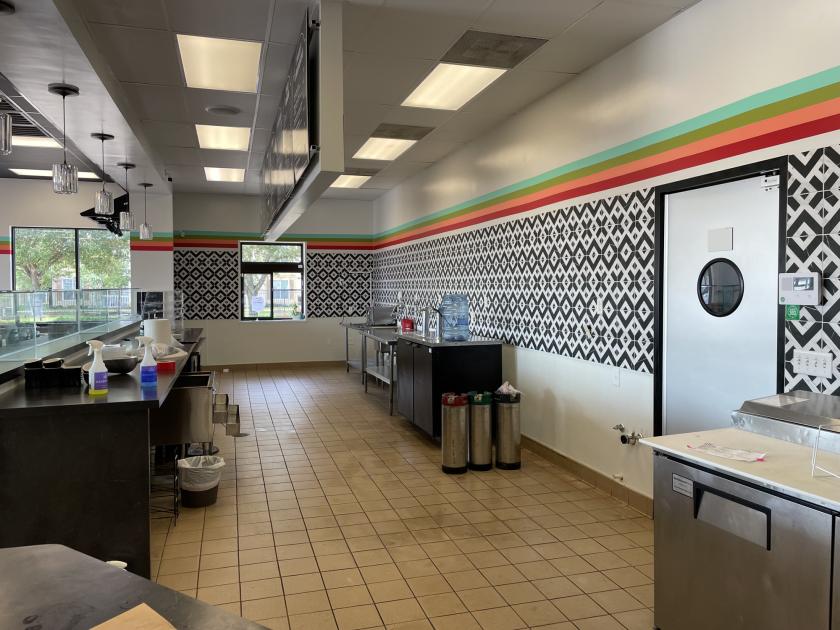
Additional Photos
Listing Agents

Tracy Eddy
O: 713-473-7200
M: 713-907-1707
tracy@texascres.com
O: 713-473-7200
M: 713-907-1707
tracy@texascres.com
While we strive to provide the most accurate information, all listing information, and demographic data, is provided by third-parties. As such, MyEListing will not be responsible for the accuracy of the information. It is strongly recommended that you verify all information with the listing agent, and any relevant agencies, prior to making any decisions.