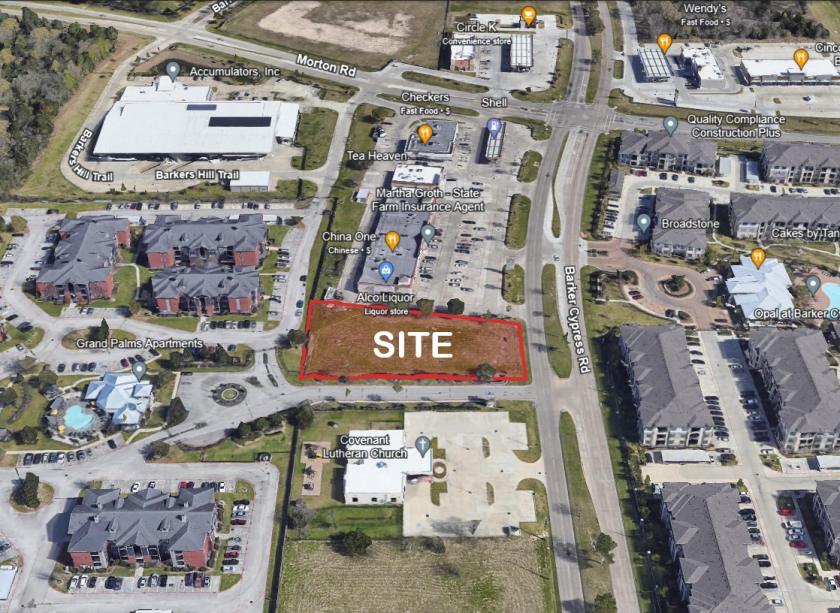
1-Mile | 3-Miles | 5-Miles | ||
---|---|---|---|---|
Total Population | 11,442 | 95,479 | 269,231 | |
Population Median Age | 31 | 34 | 34 | |
Population by Age | 0-9 Yrs | 2876 (25%) | 15801 (16%) | 41604 (15%) |
10-19 Yrs | 1202 (10%) | 13658 (14%) | 41884 (15%) | |
20-29 Yrs | 1573 (13%) | 13202 (13%) | 35554 (13%) | |
30-39 Yrs | 1876 (16%) | 15377 (16%) | 42552 (15%) | |
40-49 Yrs | 1172 (10%) | 12420 (13%) | 36985 (13%) | |
50-59 Yrs | 1600 (13%) | 12268 (12%) | 32032 (11%) | |
60-69 Yrs | 628 (5%) | 7706 (8%) | 23818 (8%) | |
70+ Yrs | 515 (4%) | 5048 (5%) | 14803 (5%) | |
Median HH Income | $92,267 | $76,319 | $75,663 | |
Total Household Income | < 24K | 158 (5%) | 3121 (10%) | 8493 (9%) |
25-49K | 547 (17%) | 5634 (18%) | 17508 (20%) | |
50-74K | 362 (11%) | 5981 (19%) | 17365 (19%) | |
75-99K | 721 (23%) | 5335 (17%) | 13268 (15%) | |
100-199K | 1129 (36%) | 8212 (27%) | 24452 (27%) | |
200K+ | 213 (6%) | 1752 (5%) | 6351 (7%) | |
Highest Education Level | No Diploma | 729 | 7939 | 22768 |
Diploma or GED | 963 | 12617 | 34729 | |
Some College | 1887 | 14338 | 36287 | |
Assoc. Degree | 973 | 5388 | 15592 | |
Bachelors Degree | 1349 | 13619 | 40881 | |
Higher Degree | 707 | 5571 | 18631 | |
Total Housing Units | 3,351 | 31,968 | 93,508 | |
--Owner-Occupied | 2,366 | 19,523 | 56,238 | |
--Renter-Occupied | 765 | 10,511 | 31,199 | |
Owner-Occupied Values | < 100K | 128 | 1511 | 3299 |
100-199K | 1181 | 10939 | 30259 | |
200-299K | 1013 | 5267 | 14198 | |
300-399K | 11 | 1027 | 4317 | |
400-499K | 11 | 499 | 1999 | |
500K+ | 21 | 280 | 2167 | |
Total Working Age Population | 7,787 | 70,851 | 200,025 | |
In Work Force | 5,629 | 51,120 | 141,964 | |
Not In Work Force | 2,158 | 19,731 | 58,061 | |
Workforce Employed | 5,276 | 48,051 | 134,070 | |
Workforce Unemployed | 353 | 3,059 | 7,746 | |
Civlian Workforce | 5,629 | 51,110 | 141,816 | |
Military Workforce | 0 | 10 | 148 | |
Total Households | 3,131 | 30,034 | 87,437 | |
Family Households | 2,472 | 23,792 | 67,224 | |
Non-Family Households | 658 | 6,243 | 20,214 | |
Married Couple | 1,934 | 17,298 | 48,293 | |
Other Family | 538 | 6,494 | 18,931 | |
Married w/Child | 1,030 | 8,808 | 24,795 | |
Single Male w/Child | 43 | 661 | 2,237 | |
Single Female w/Child | 218 | 2,742 | 8,062 |
Population Change Last Two Decades - Plus Projection
2000 | % | 2010 | % | 2020 | % | 2030 | |
---|---|---|---|---|---|---|---|
Texas | 20,851,820 | +21 | 25,145,561 | +18 | 29,677,668 | +18 | 34,894,452 |
Harris County | 3,400,578 | +20 | 4,092,459 | +22 | 4,978,845 | +19 | 5,924,750 |
Total Working Age Population:
Total Households:
Total Working Age Population:
Total Households:
Total Working Age Population:
Total Households: