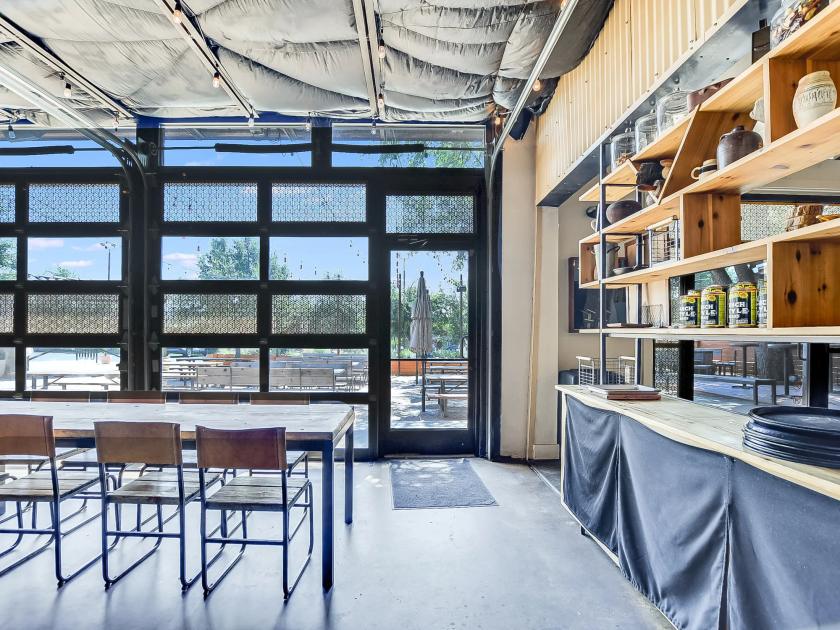
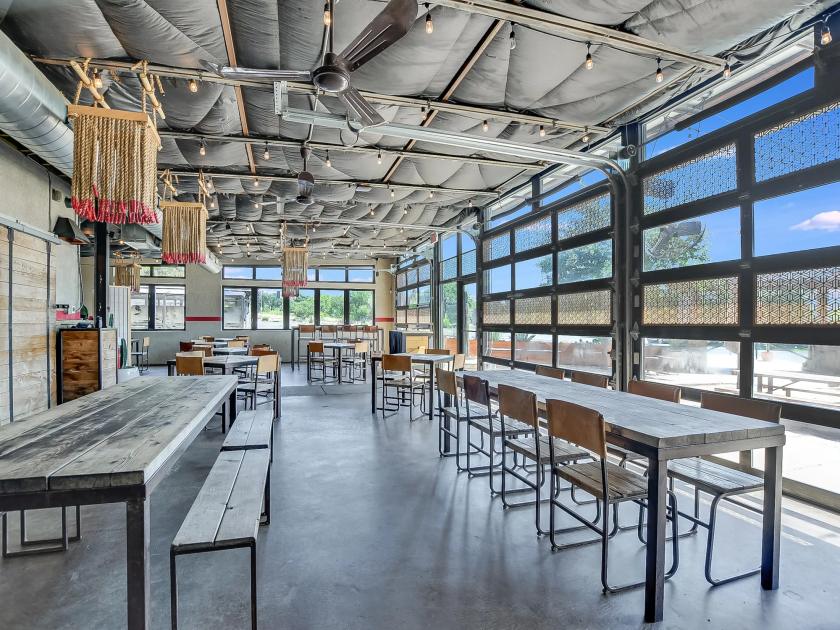
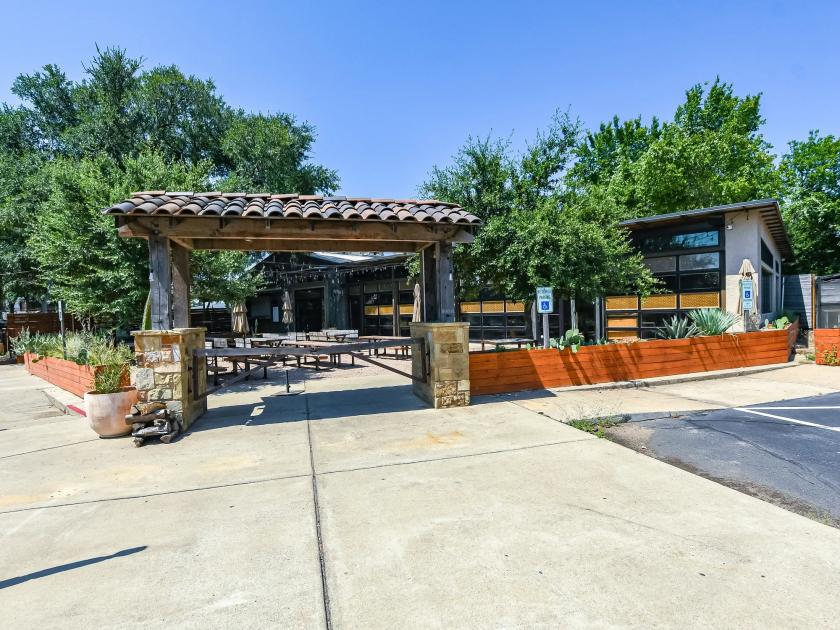
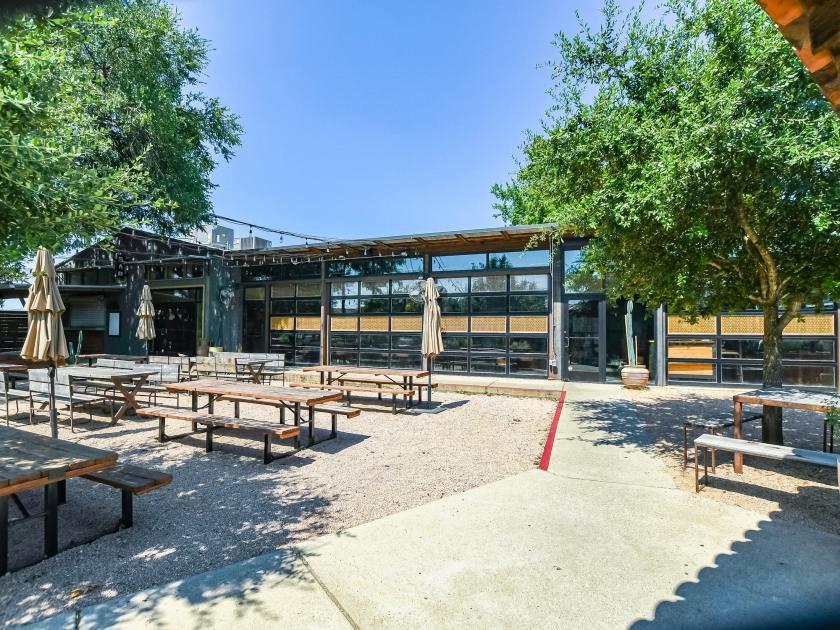
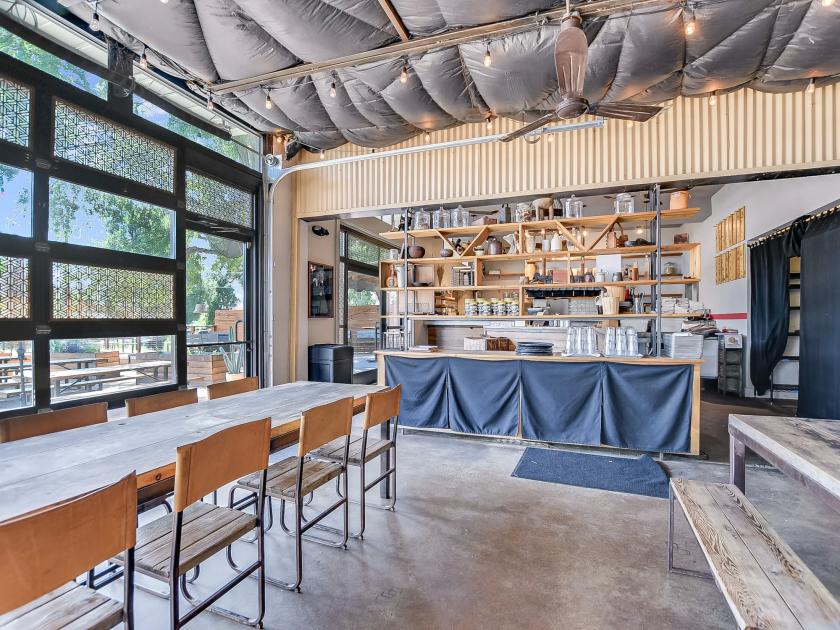
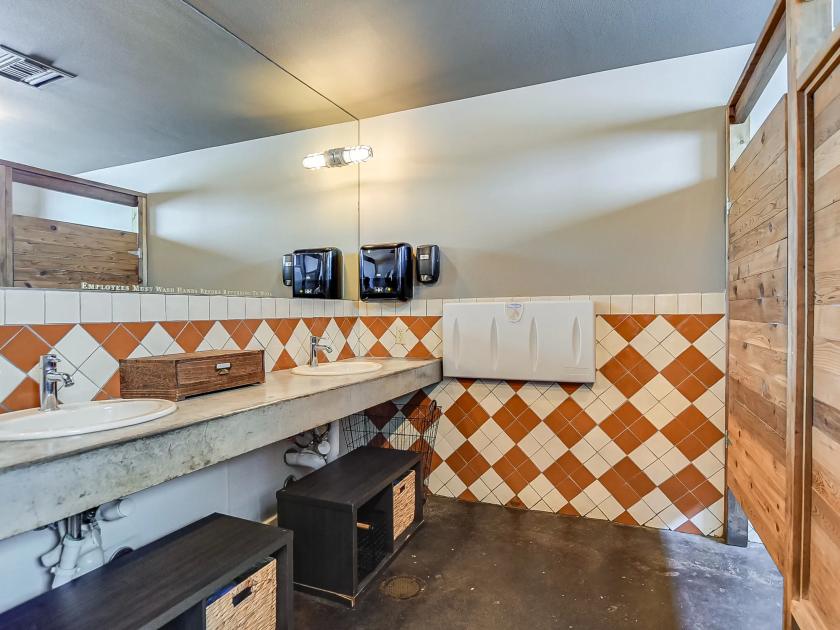
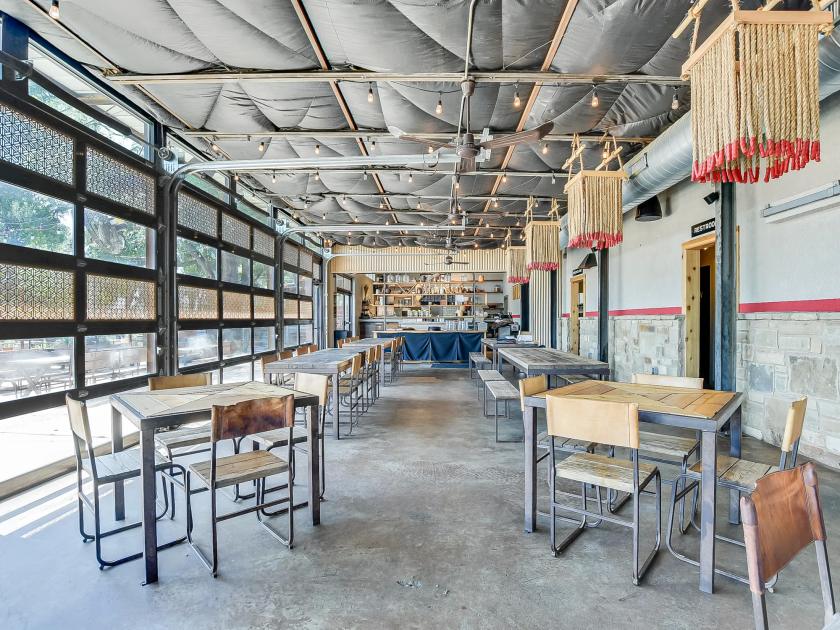
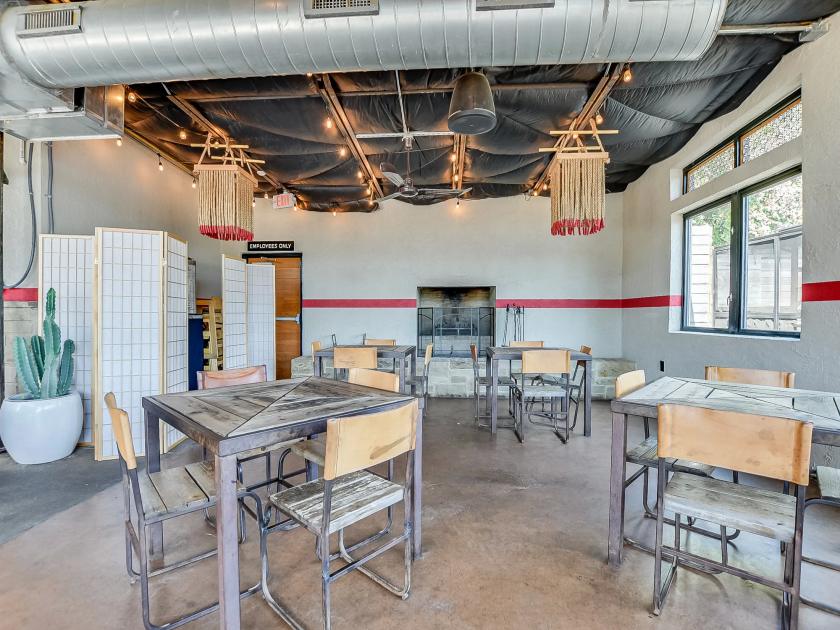
Retail Space
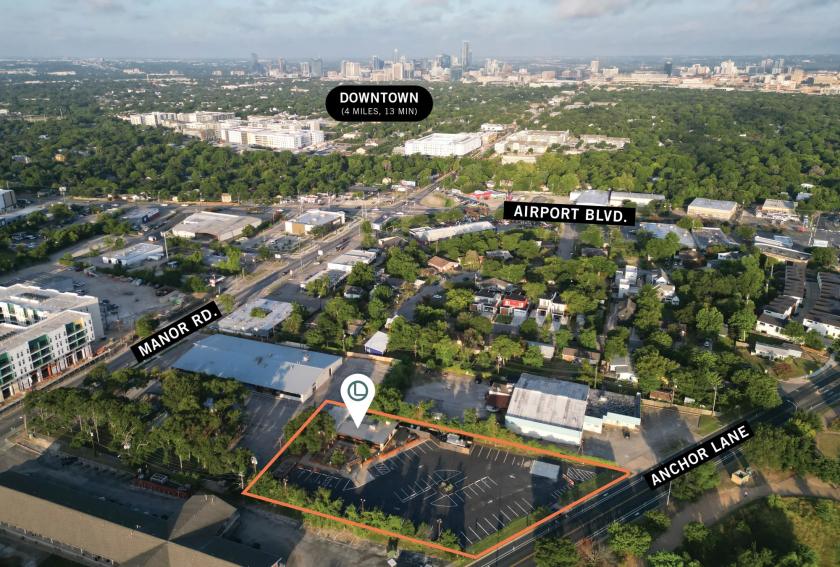
2027 Anchor Lane Austin, TX 78723
2027 Anchor Lane Austin, TX 78723
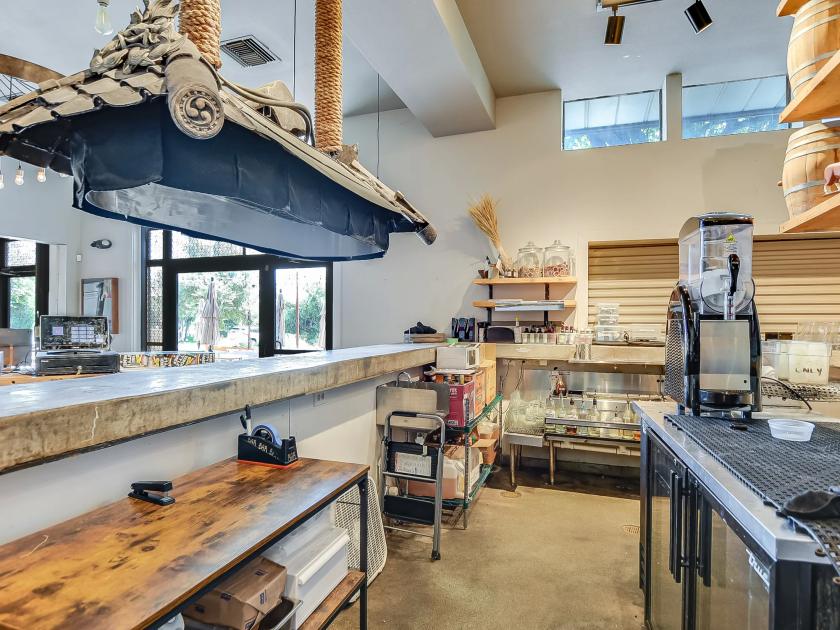
Details & Description
Property Highlights
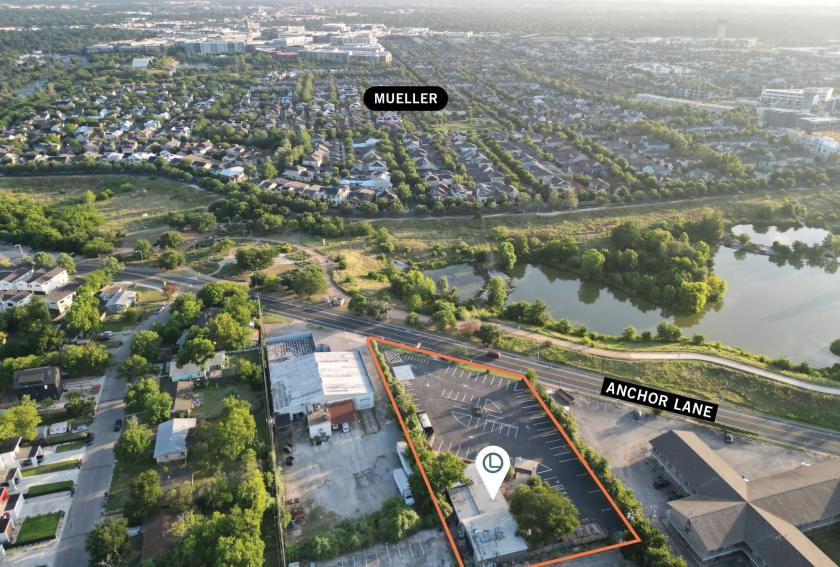
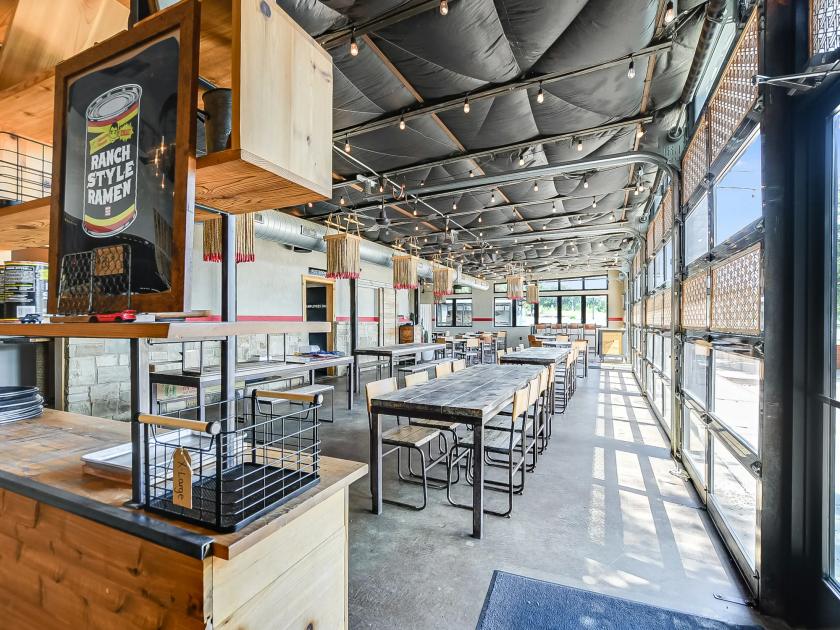
- • Building Size: +/- 2,058 SF
- • Lot Size: +/- 1 acre
- • Zoning: CS-MU-NP
- • Parking: 63 surface
- • Submarket: East Austin • Mueller
- • Neighborhood Plan: MLK
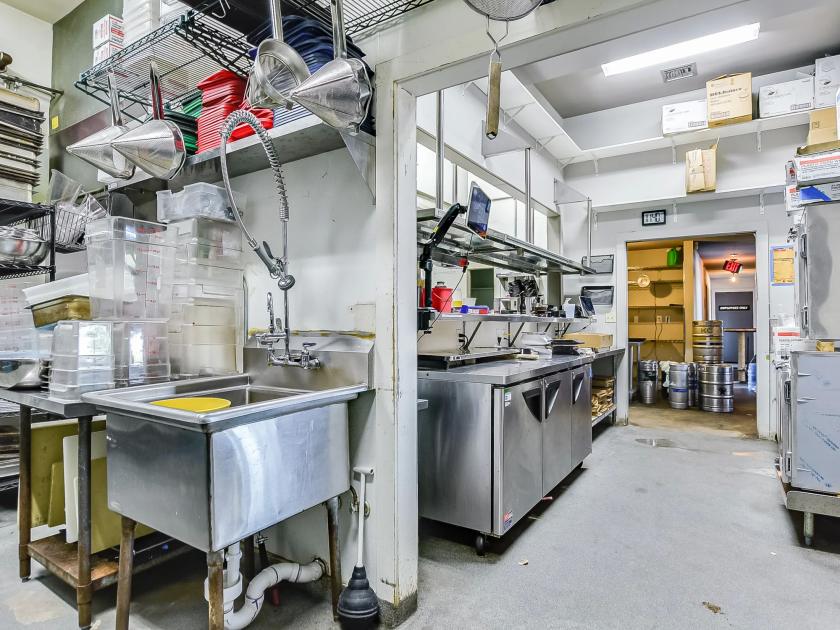
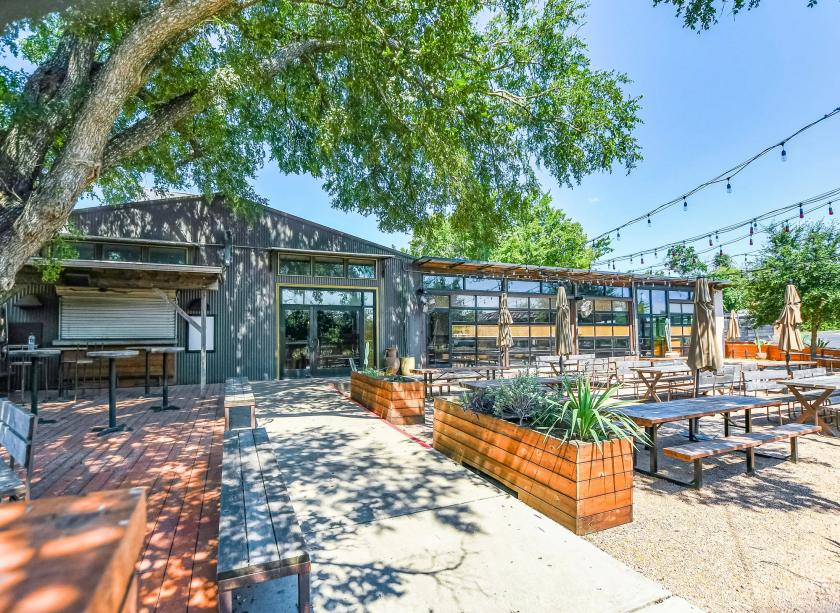
Additional Photos

Listing Agents

Tim Mooney
O: 512-467-2222
M: 512-658-4916
tim@leadcommercial.com
O: 512-467-2222
M: 512-658-4916
tim@leadcommercial.com

Perry Horton
O: 512-467-2222
M: 512-415-4565
perry@leadcommercial.com
O: 512-467-2222
M: 512-415-4565
perry@leadcommercial.com
While we strive to provide the most accurate information, all listing information, and demographic data, is provided by third-parties. As such, MyEListing will not be responsible for the accuracy of the information. It is strongly recommended that you verify all information with the listing agent, and any relevant agencies, prior to making any decisions.