Office Space
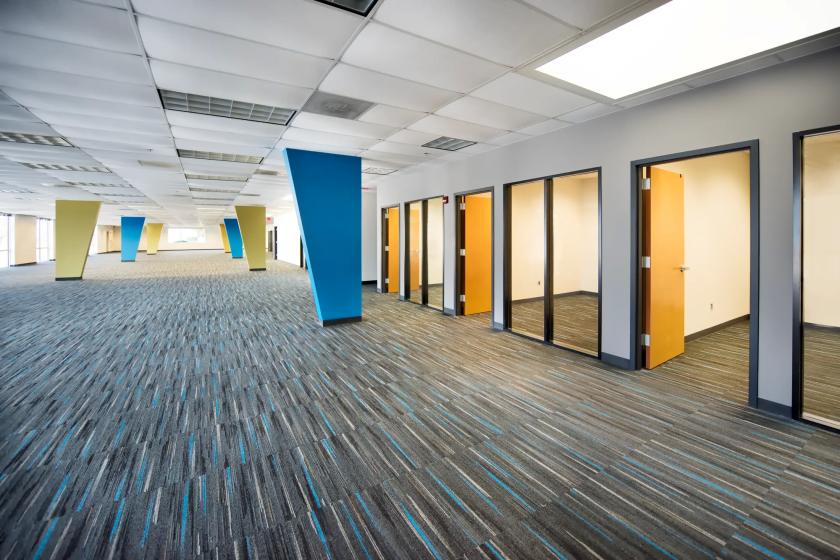
1905 A Kramer Lane - Suite 100 Austin, TX 78758
1905 A Kramer Lane - Suite 100 Austin, TX 78758
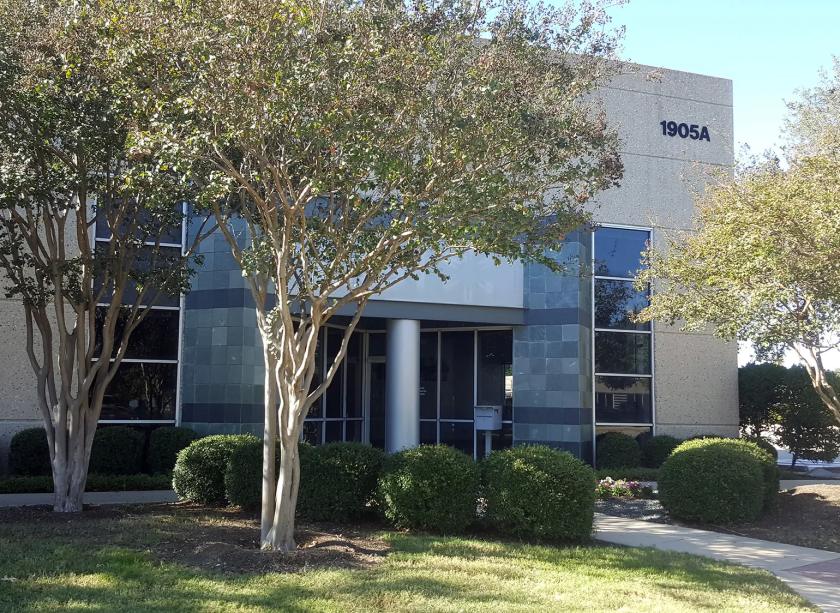
Details & Description
Property Highlights
- • Rental Rate: Contact Broker
- • OPEX: $5.50/SF
- • Available: August 15, 2023
- • Lease Term: November 30, 2026
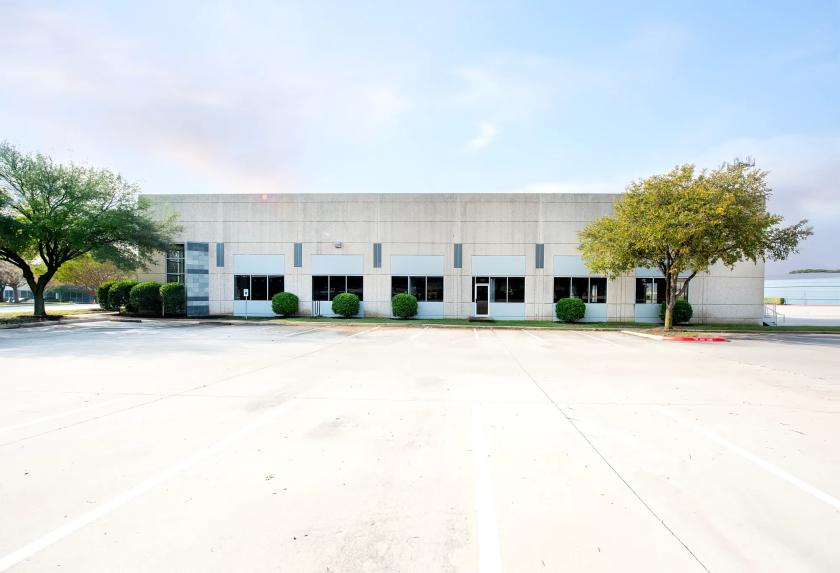
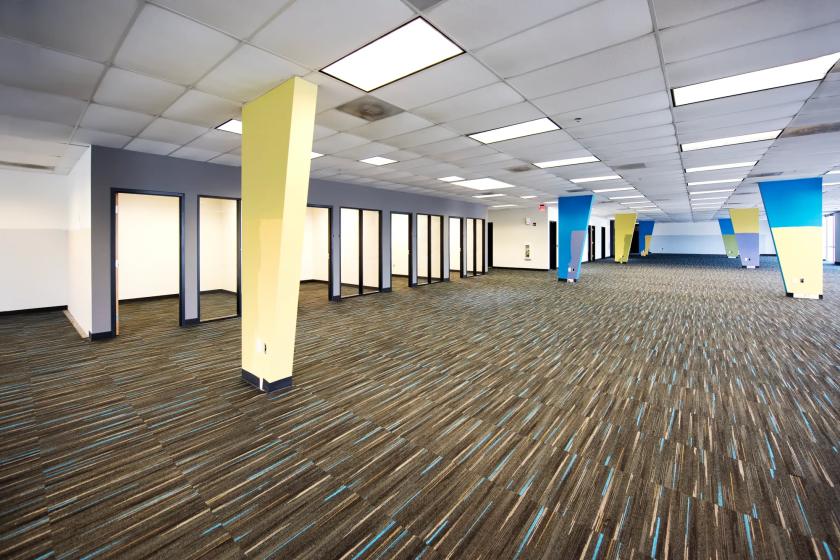
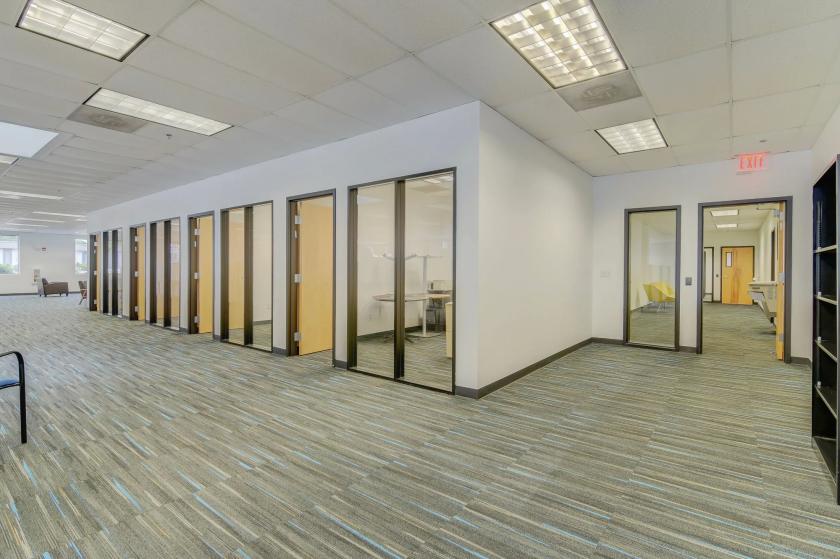
Additional Photos
Listing Agents

Tim Mooney
O: 512-467-2222
M: 512-658-4916
tim@leadcommercial.com
O: 512-467-2222
M: 512-658-4916
tim@leadcommercial.com

Christopher Holcomb
O: 512-467-2222
M: 512-507-5799
christopher@leadcommercial.com
O: 512-467-2222
M: 512-507-5799
christopher@leadcommercial.com
While we strive to provide the most accurate information, all listing information, and demographic data, is provided by third-parties. As such, MyEListing will not be responsible for the accuracy of the information. It is strongly recommended that you verify all information with the listing agent, and any relevant agencies, prior to making any decisions.


