Office Space
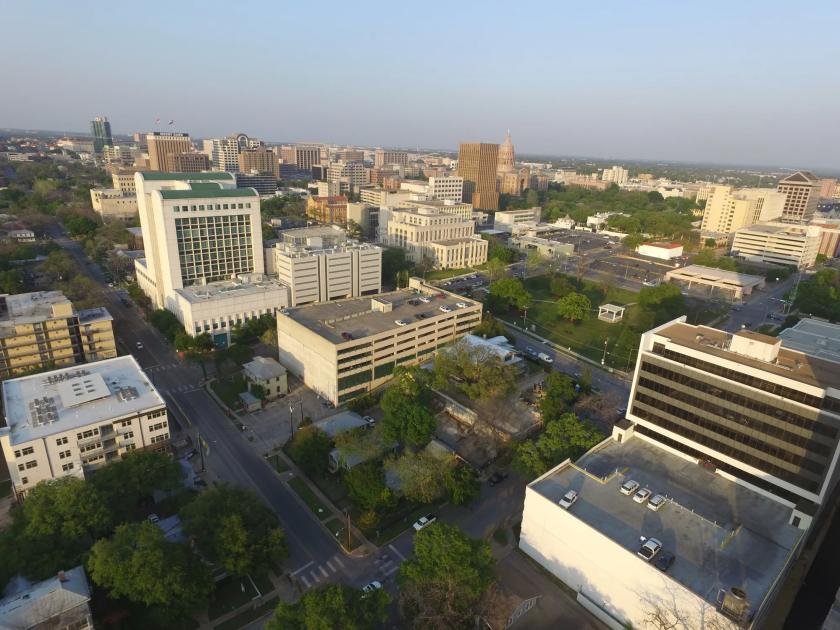
NE Corner of 9th Street and Nueces St Austin, TX 78701
NE Corner of 9th Street and Nueces St Austin, TX 78701
Details & Description
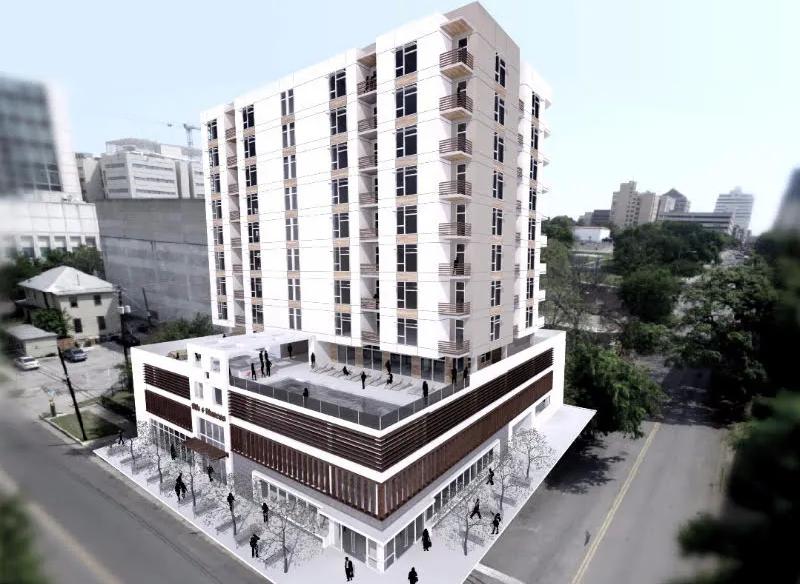
Property Highlights
- • Addresses: 901, 903 & 905 Nueces
- • Height: 120' and 220'
- • FAR: 5:1 and 8:1 (Density Bonus)
Listing Agents

Perry Horton
O: 512-467-2222
M: 512-415-4565
perry@leadcommercial.com
O: 512-467-2222
M: 512-415-4565
perry@leadcommercial.com
While we strive to provide the most accurate information, all listing information, and demographic data, is provided by third-parties. As such, MyEListing will not be responsible for the accuracy of the information. It is strongly recommended that you verify all information with the listing agent, and any relevant agencies, prior to making any decisions.