Office Space
6836 Bee Cave Rd - Suite I-201 Austin, TX 78746
6836 Bee Cave Rd - Suite I-201 Austin, TX 78746
Details & Description
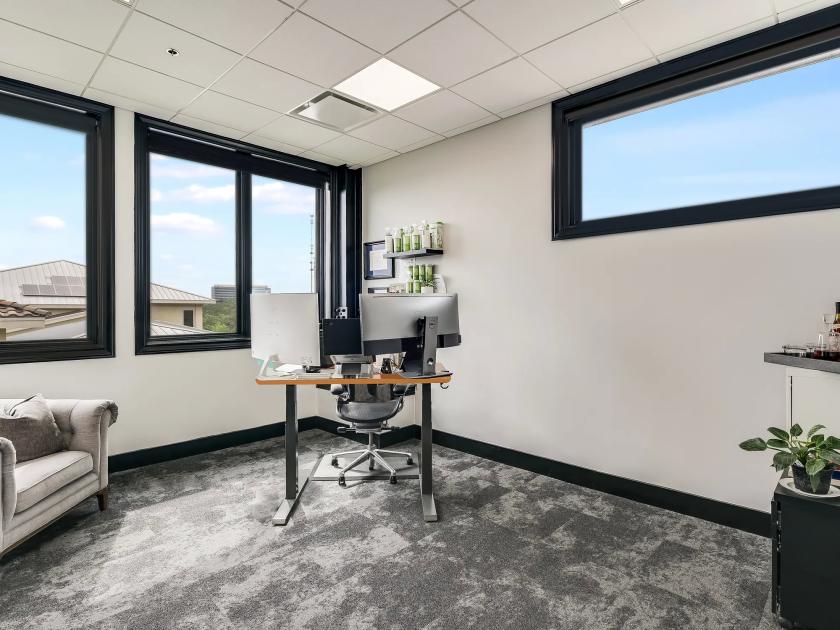
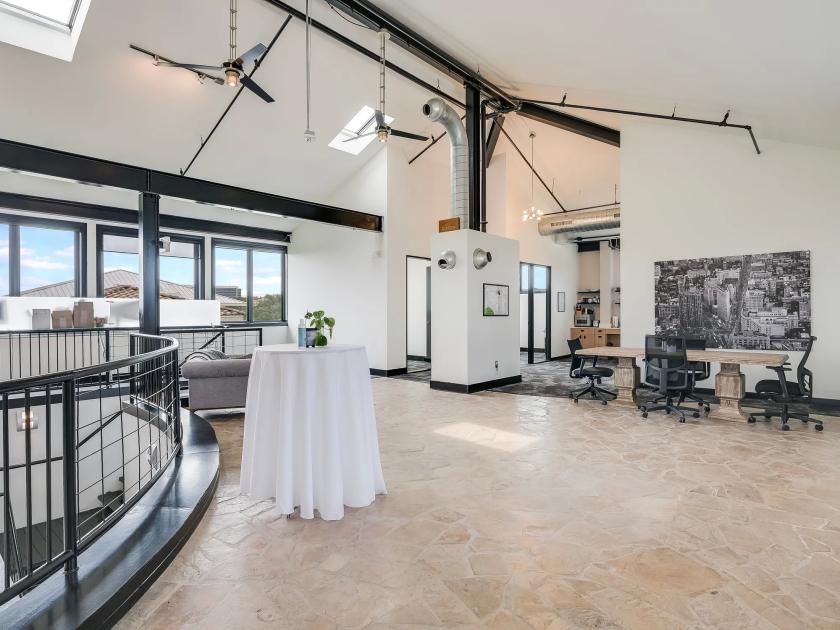
Property Highlights
- • Size: 3,665 SF
- • Parking Ratio: 3.1/1,000
- • Type: Class A Office/Loft
- • Available: Immediately
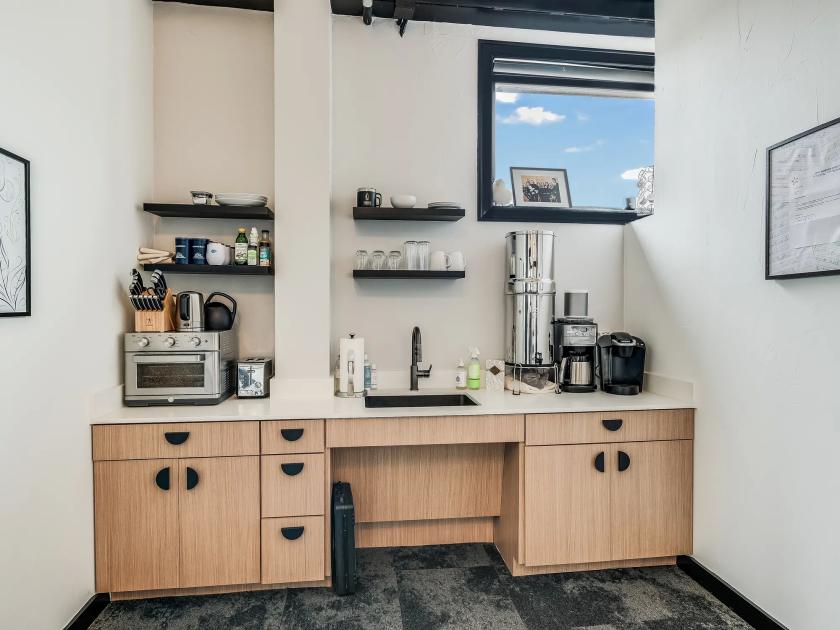
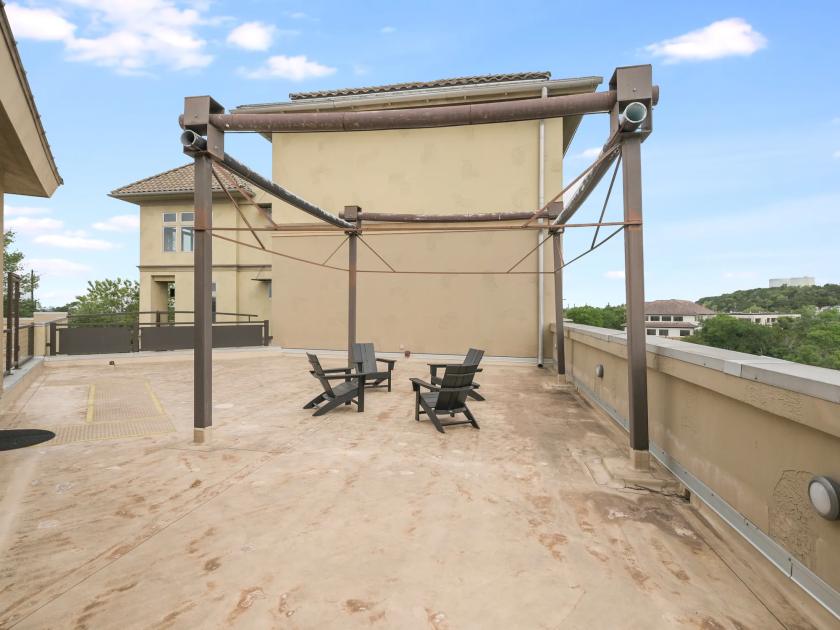
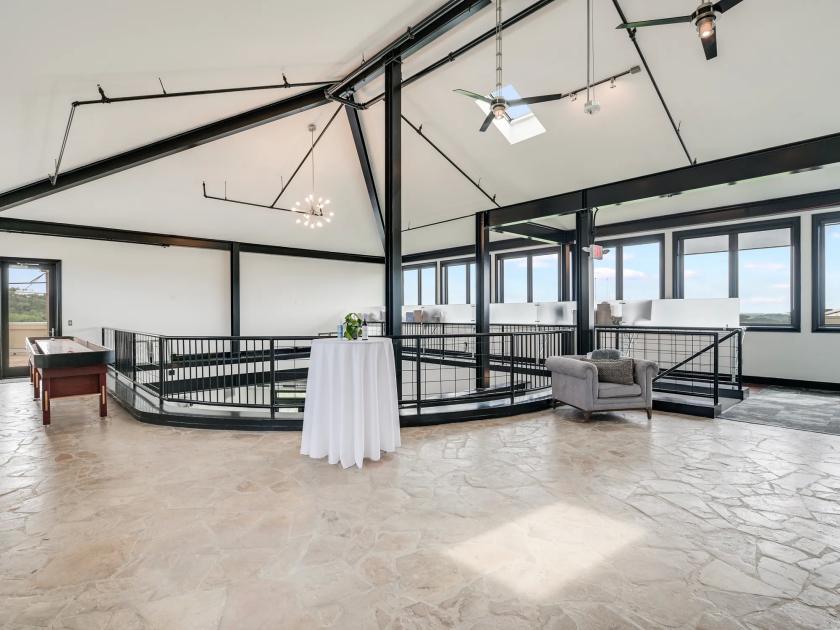
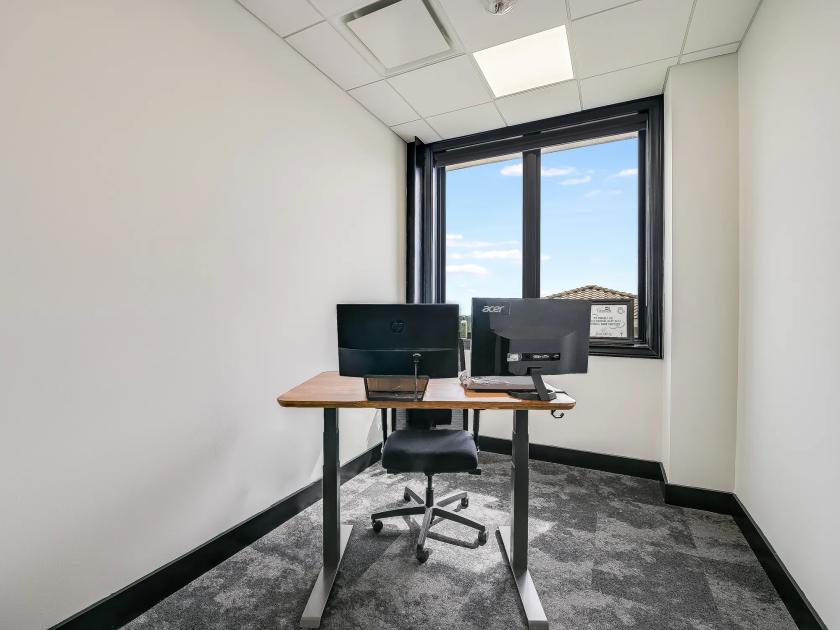
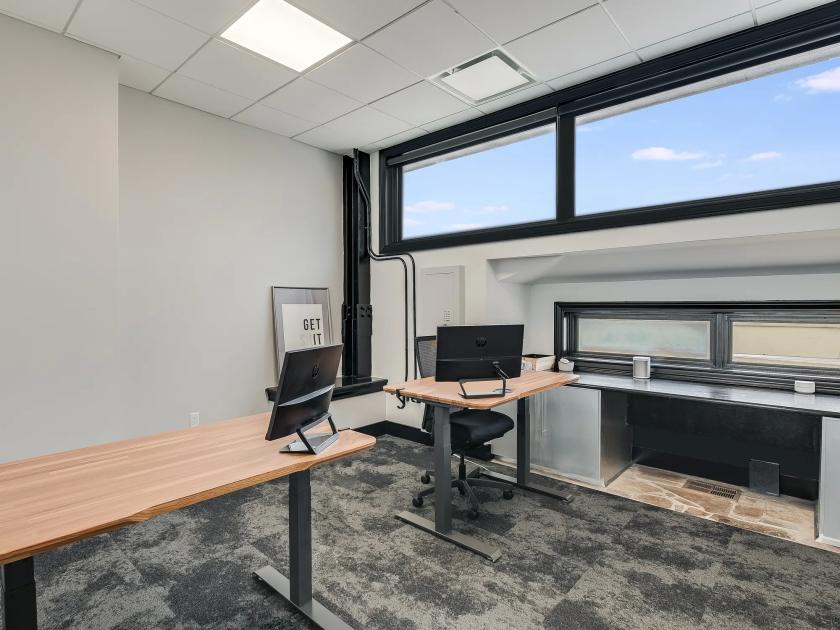
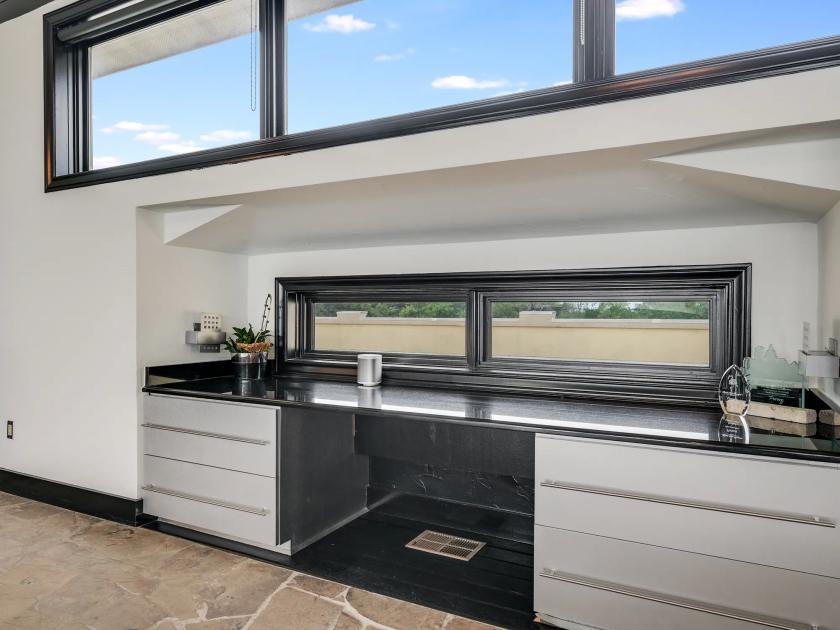
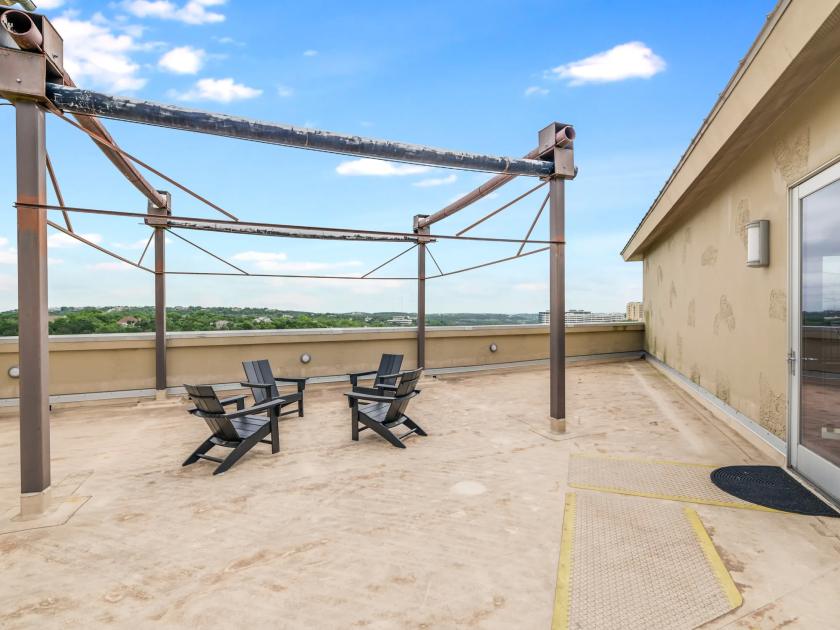
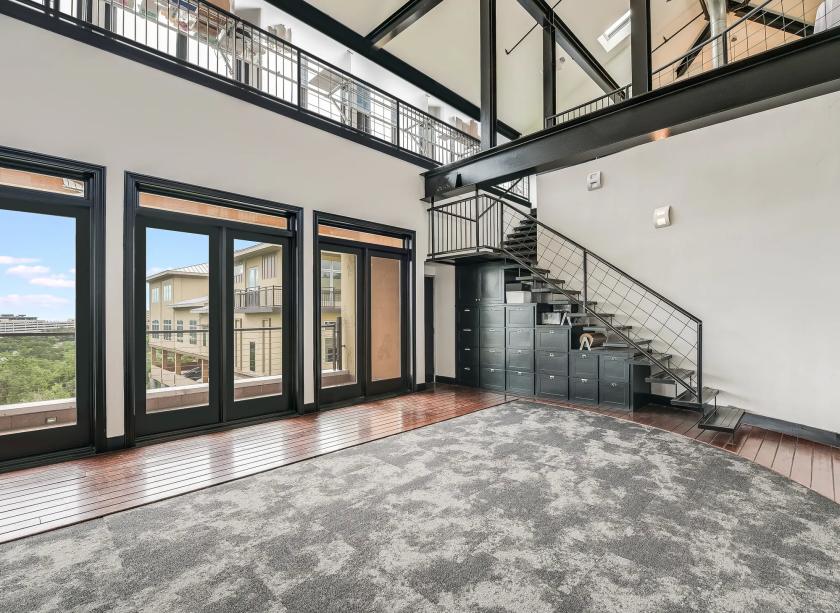
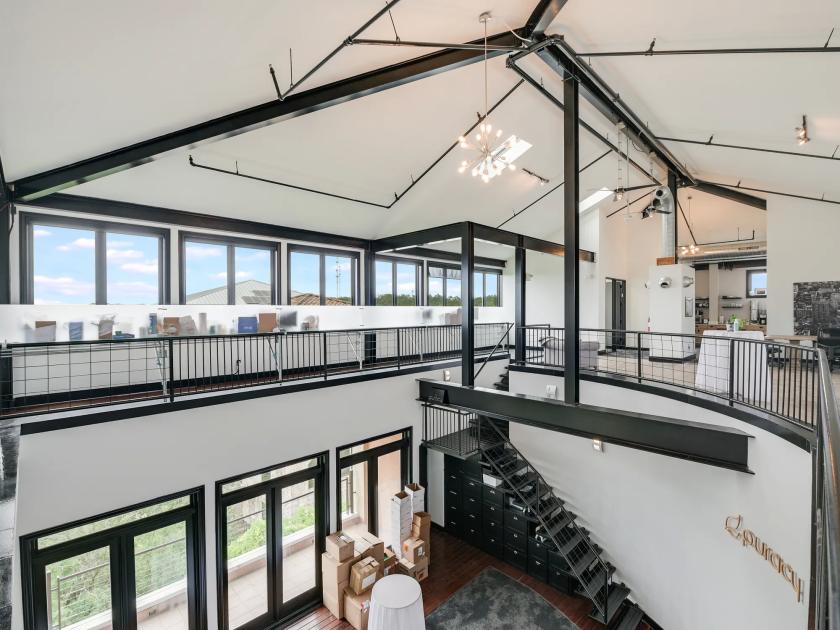
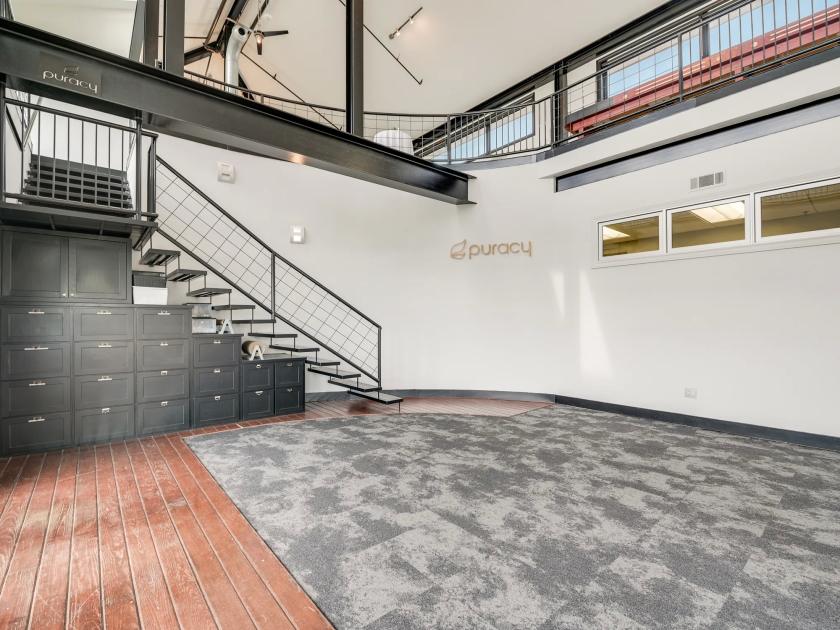
Additional Photos


Listing Agents

Perry Horton
O: 512-467-2222
M: 512-415-4565
perry@leadcommercial.com
O: 512-467-2222
M: 512-415-4565
perry@leadcommercial.com
While we strive to provide the most accurate information, all listing information, and demographic data, is provided by third-parties. As such, MyEListing will not be responsible for the accuracy of the information. It is strongly recommended that you verify all information with the listing agent, and any relevant agencies, prior to making any decisions.