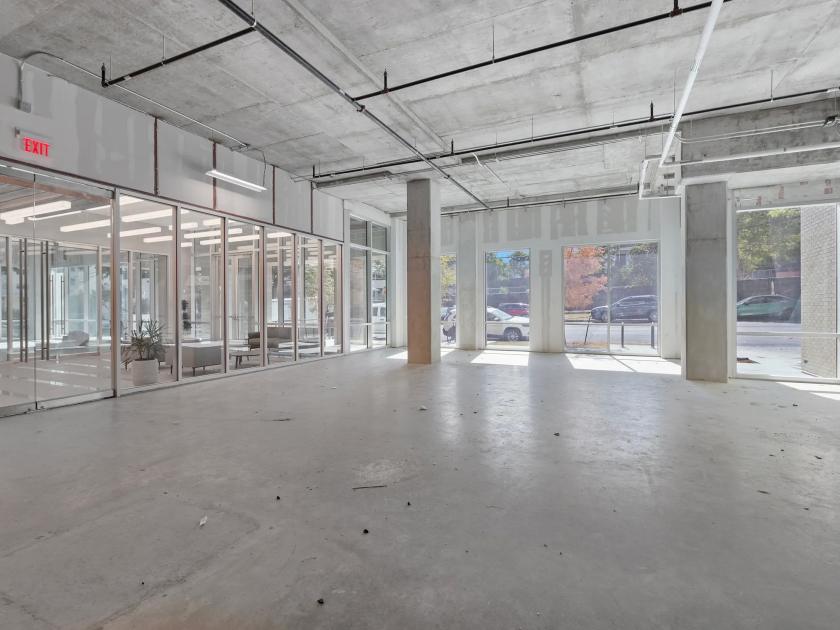
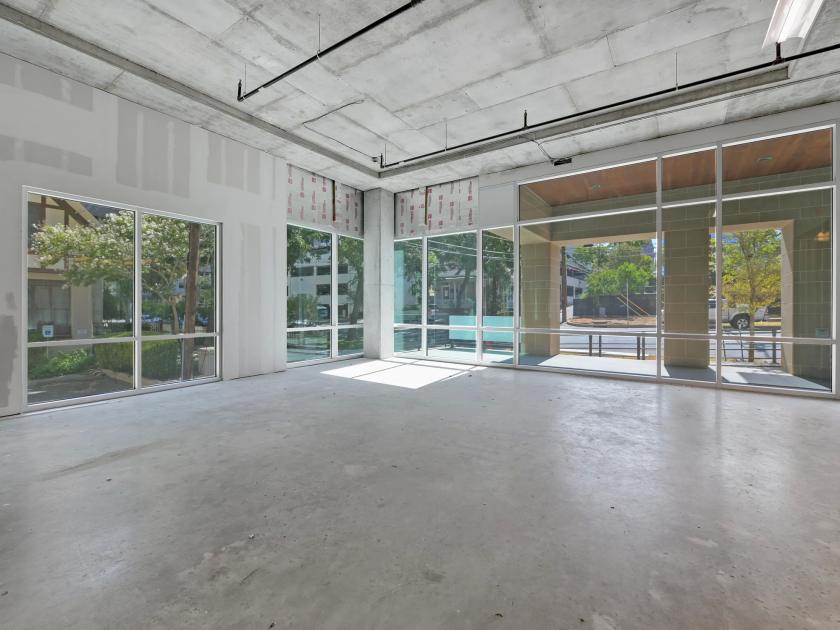
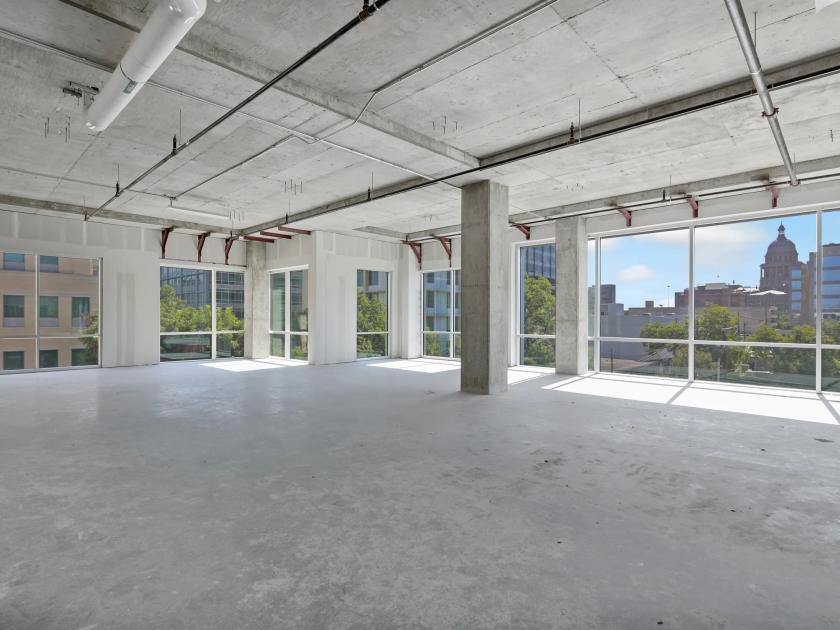
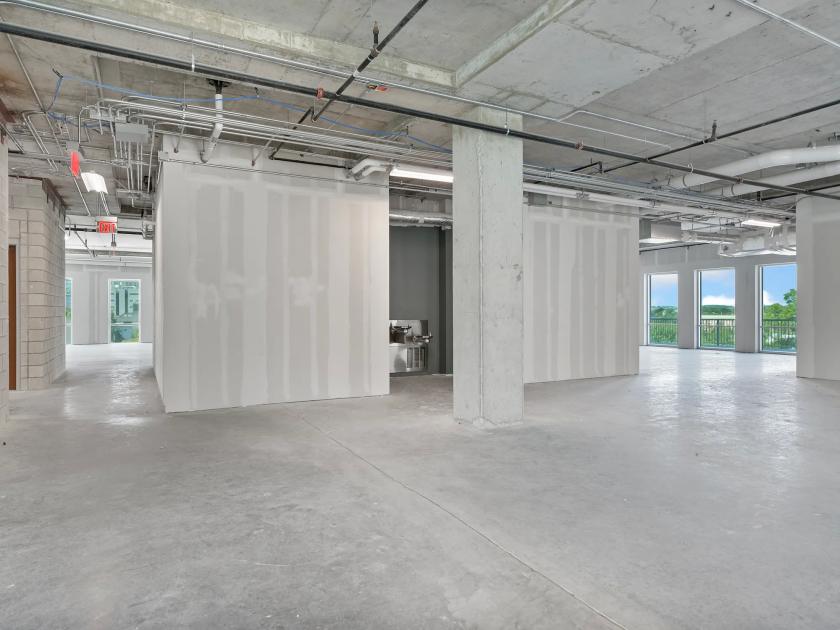
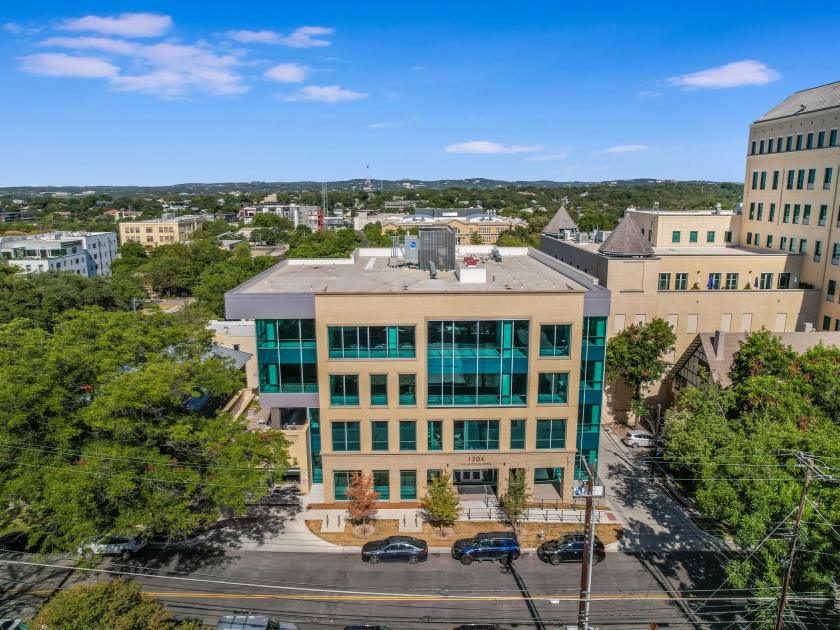
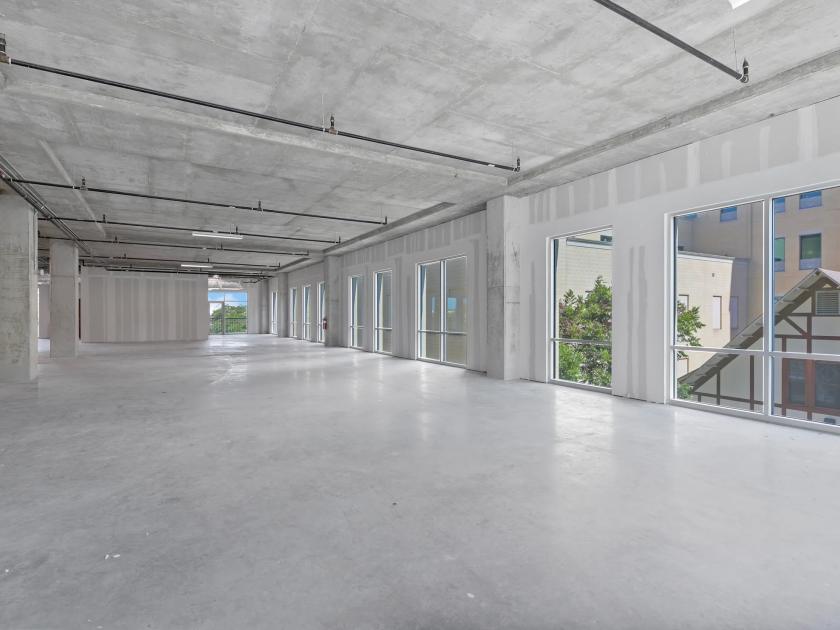
Office Space
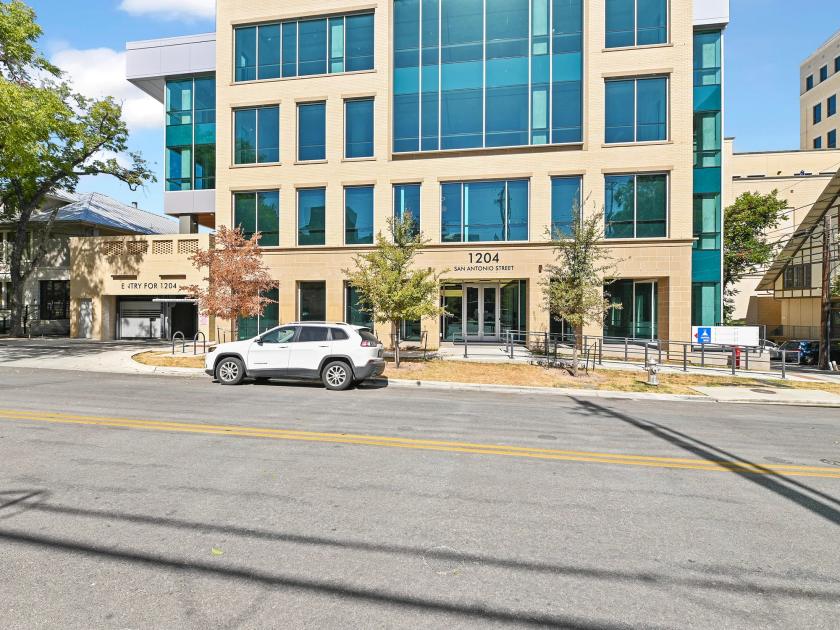
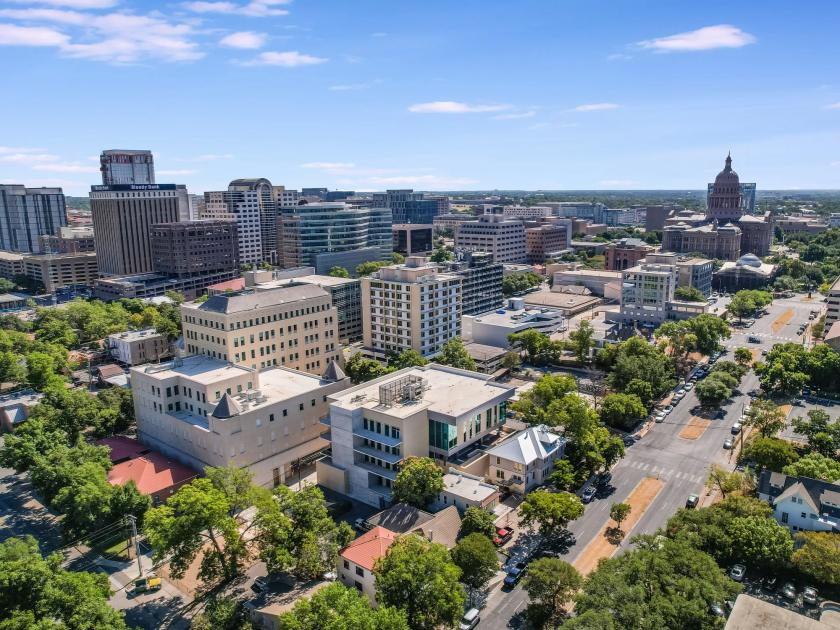
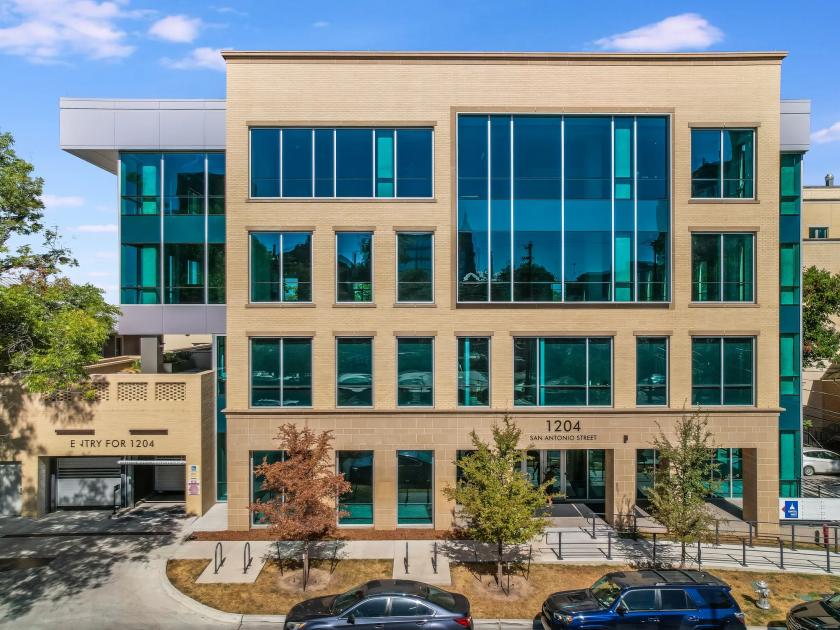
1204 San Antonio Street Austin, TX 78701
1204 San Antonio Street Austin, TX 78701
Details & Description
Property Highlights
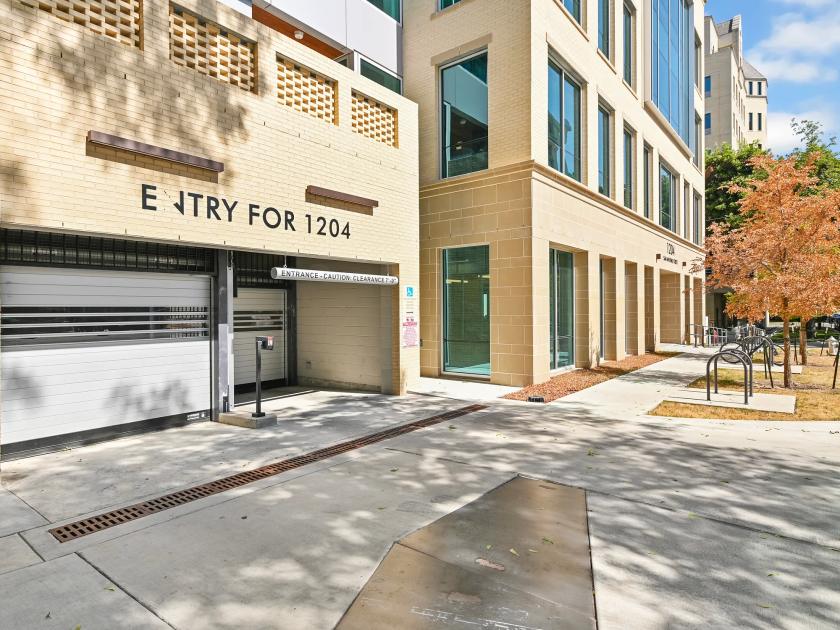
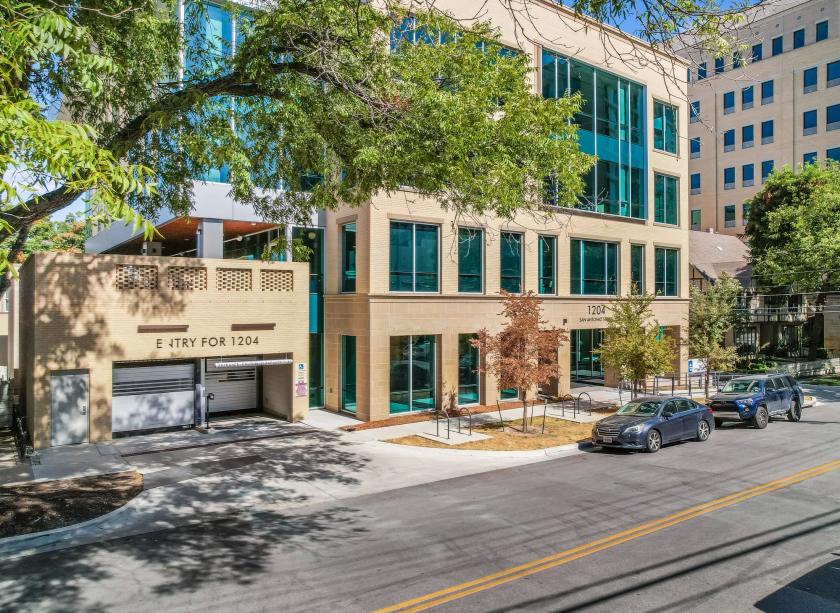
- • Easy-Access Parking Garage
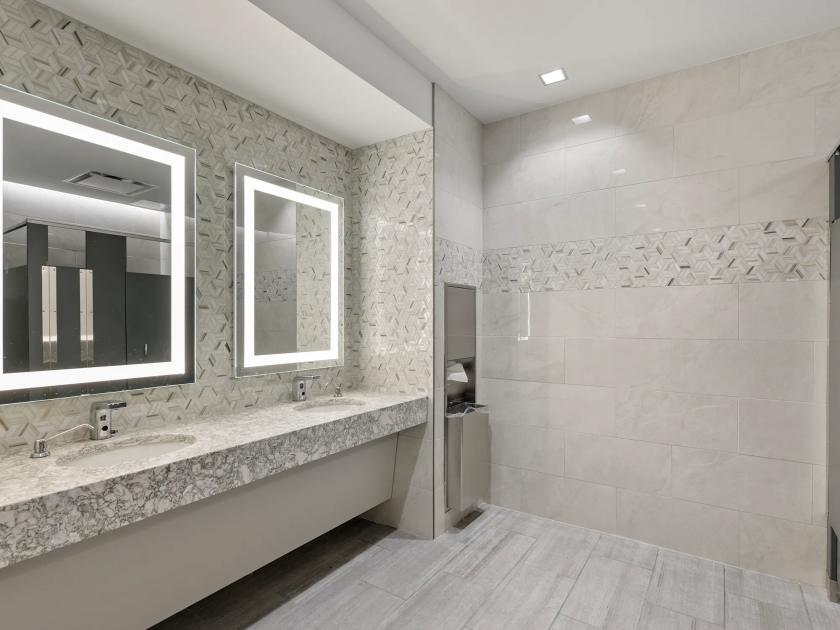
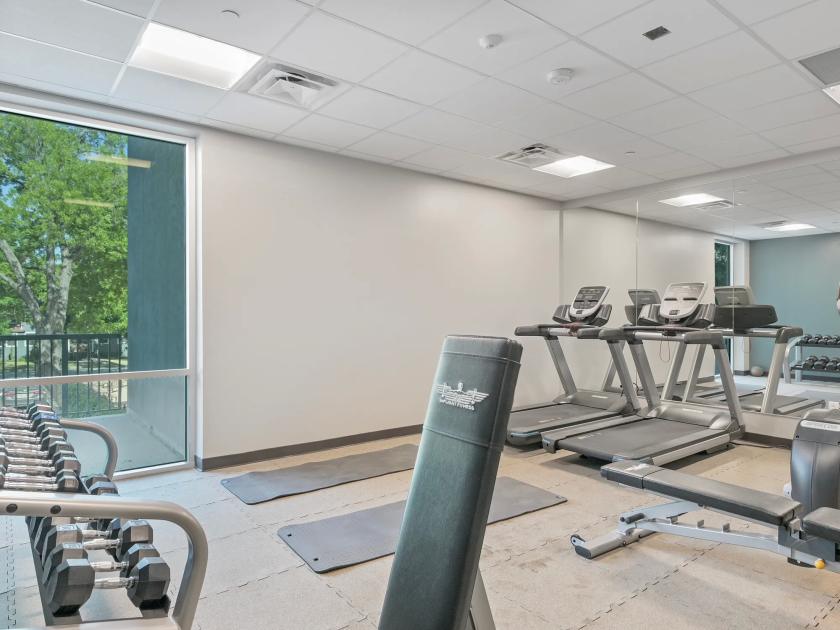
- • Fitness Facility with showers
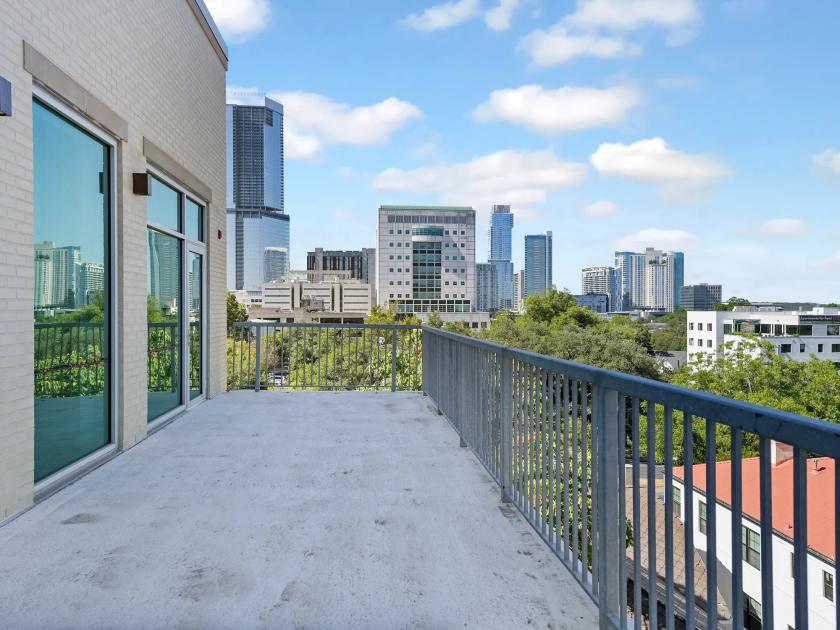
- • Private Terrace tailored to each suite
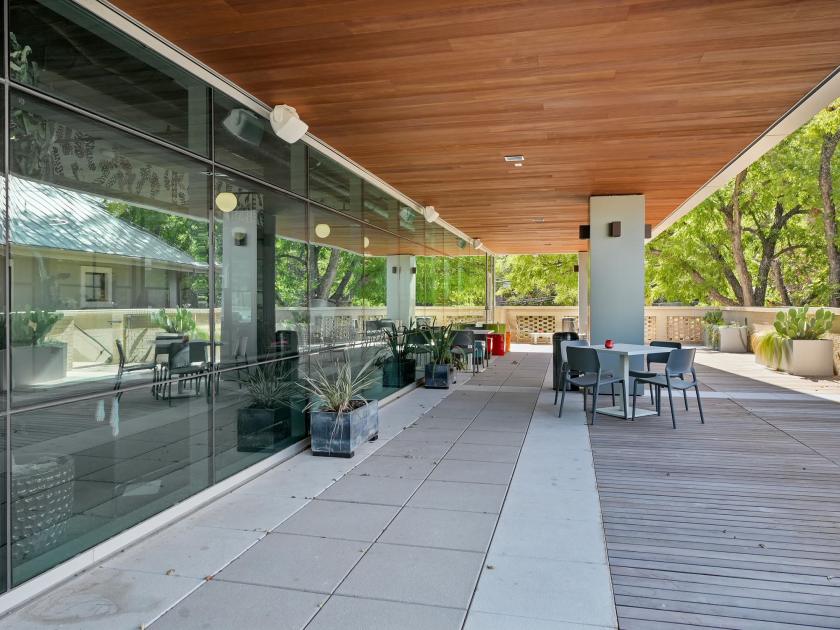
- • 2nd Floor Outdoor Terrace available to all tenants
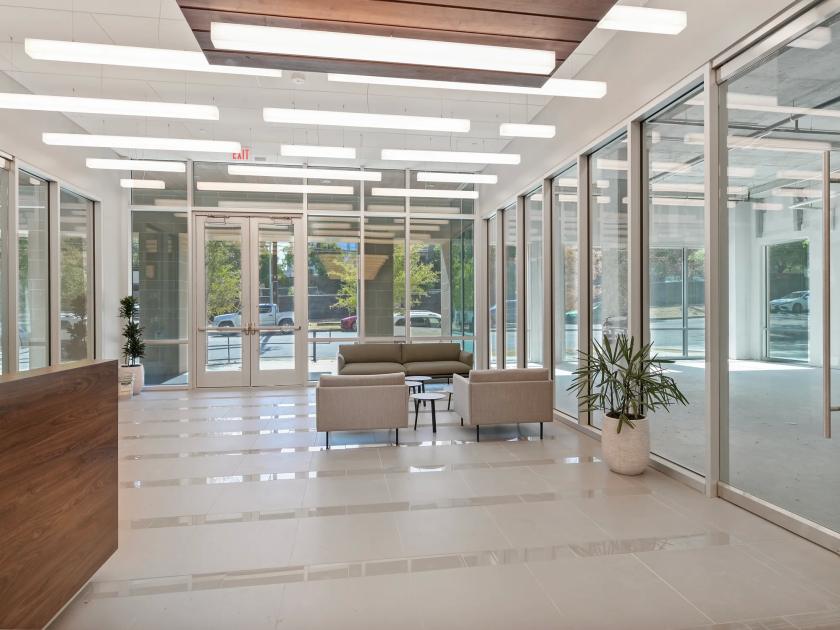
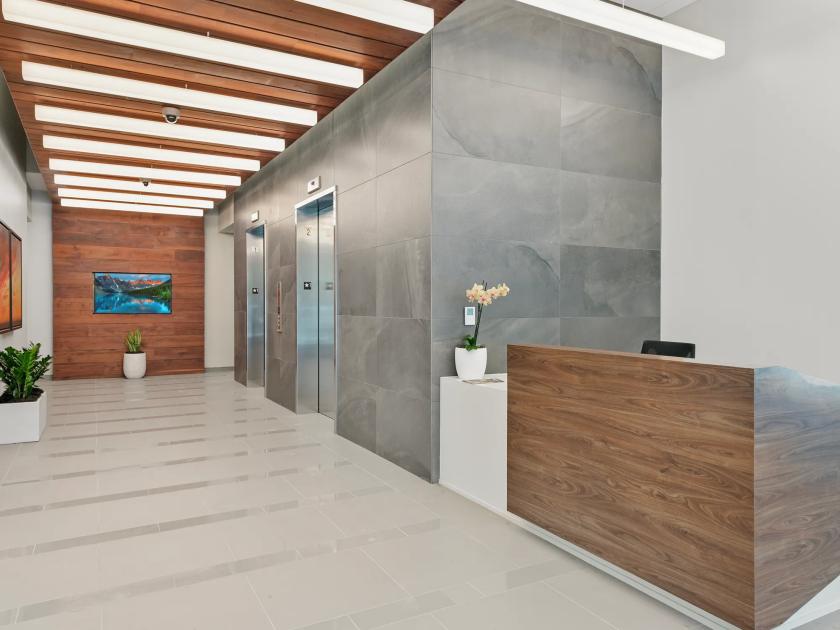
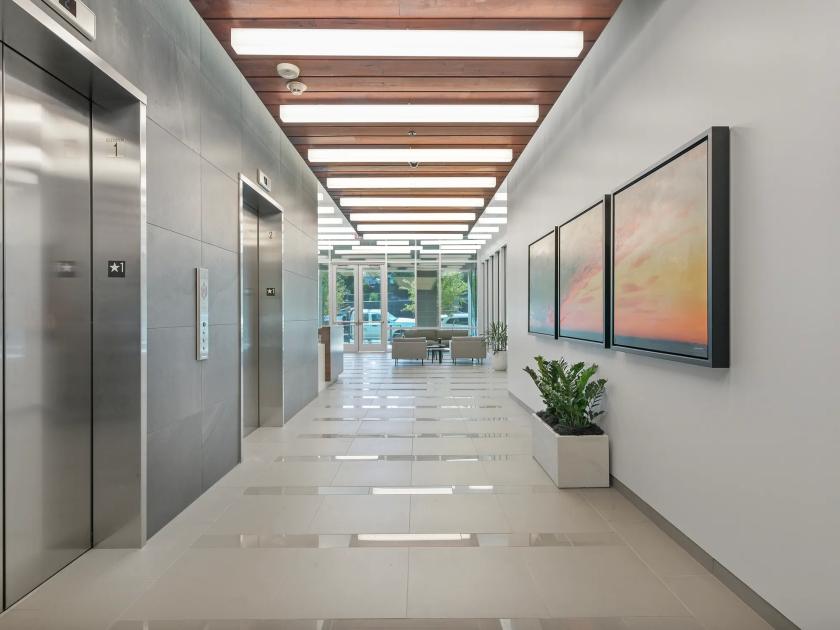
- • On site security personnel in lobby
- • Local Ownership / Management
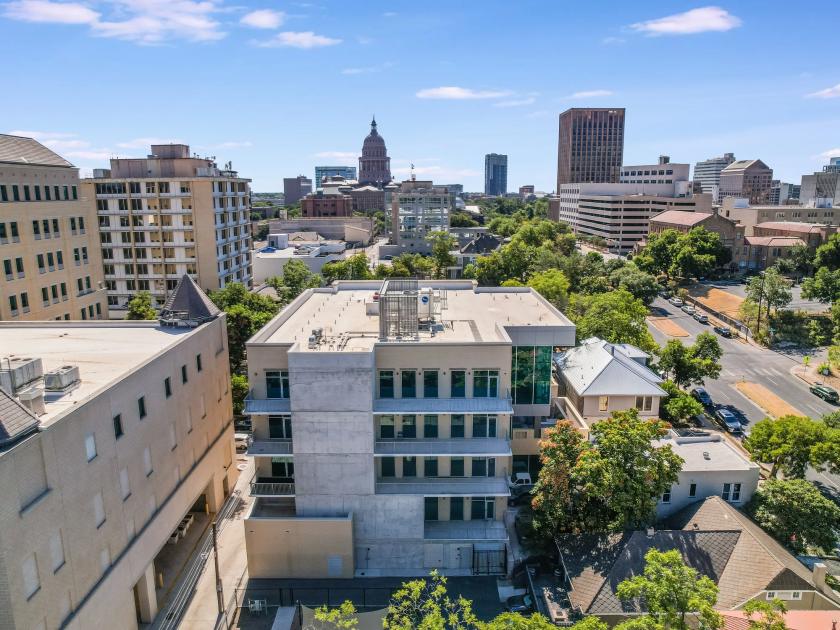
Additional Photos
Listing Agents

Perry Horton
O: 512-467-2222
M: 512-415-4565
perry@leadcommercial.com
O: 512-467-2222
M: 512-415-4565
perry@leadcommercial.com

Nick Owens
O: 512-320-9190
M: 512-202-8880
owens@@centric-re.com
O: 512-320-9190
M: 512-202-8880
owens@@centric-re.com
While we strive to provide the most accurate information, all listing information, and demographic data, is provided by third-parties. As such, MyEListing will not be responsible for the accuracy of the information. It is strongly recommended that you verify all information with the listing agent, and any relevant agencies, prior to making any decisions.