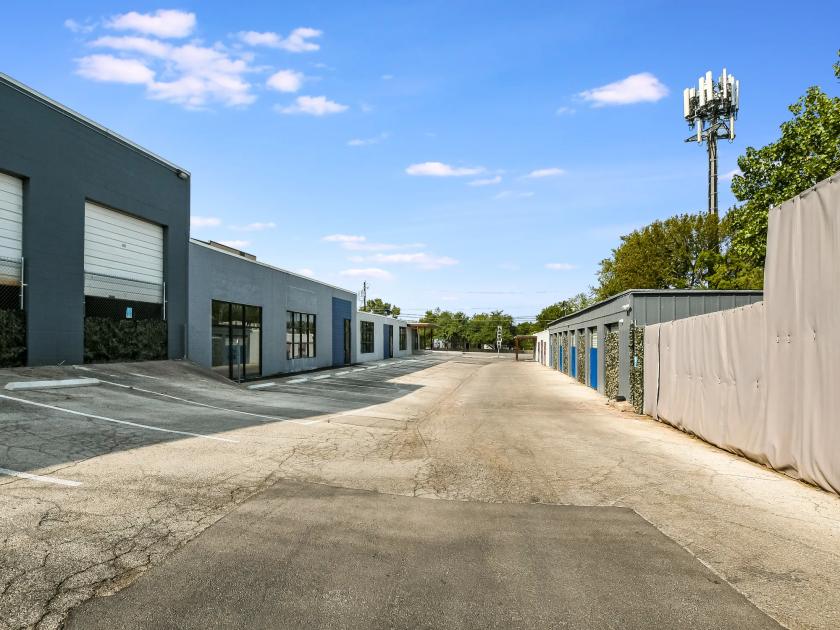
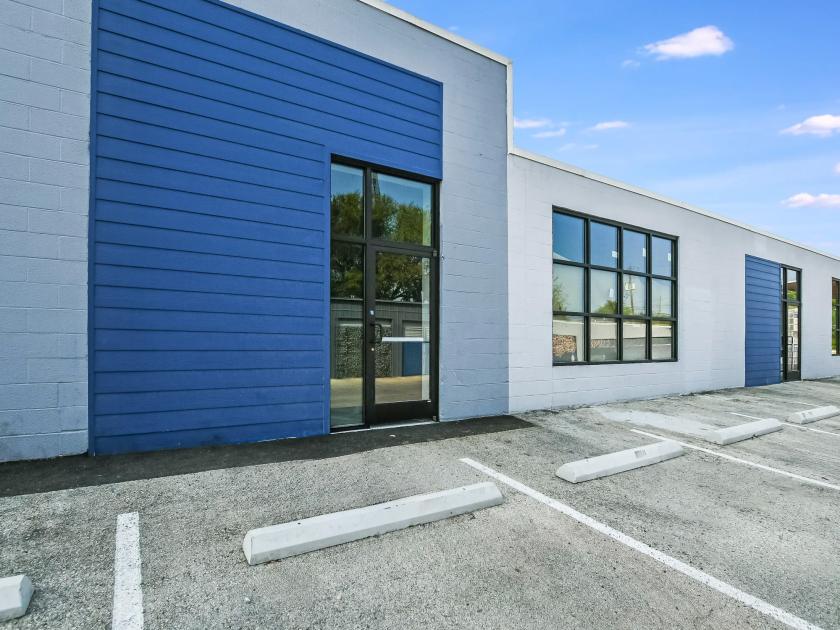
Retail Space
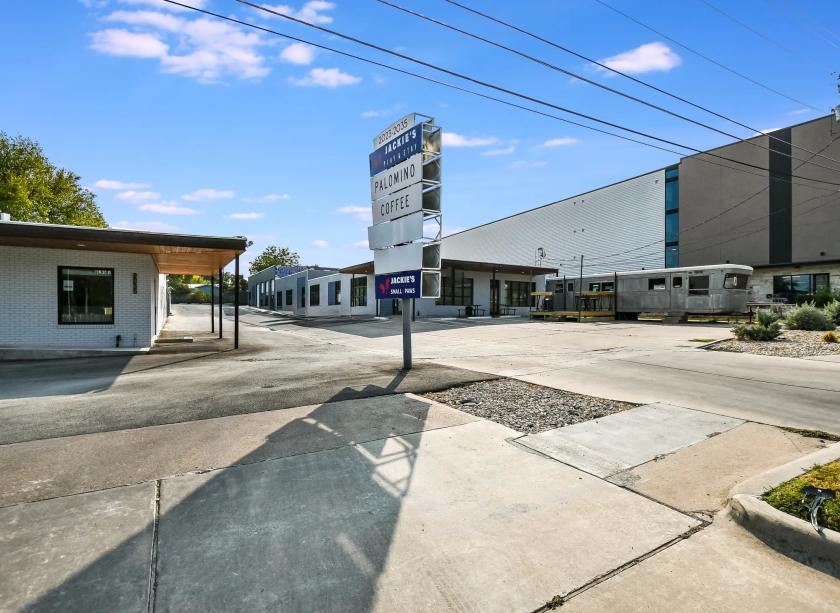
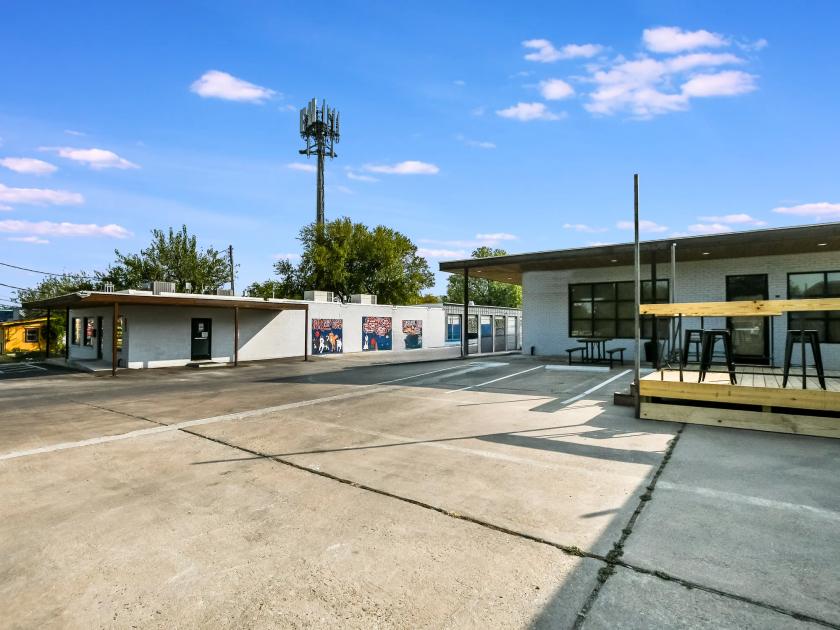
2023-2035 Airport Blvd Austin, TX 78722
2023-2035 Airport Blvd Austin, TX 78722
Details & Description
Property Highlights
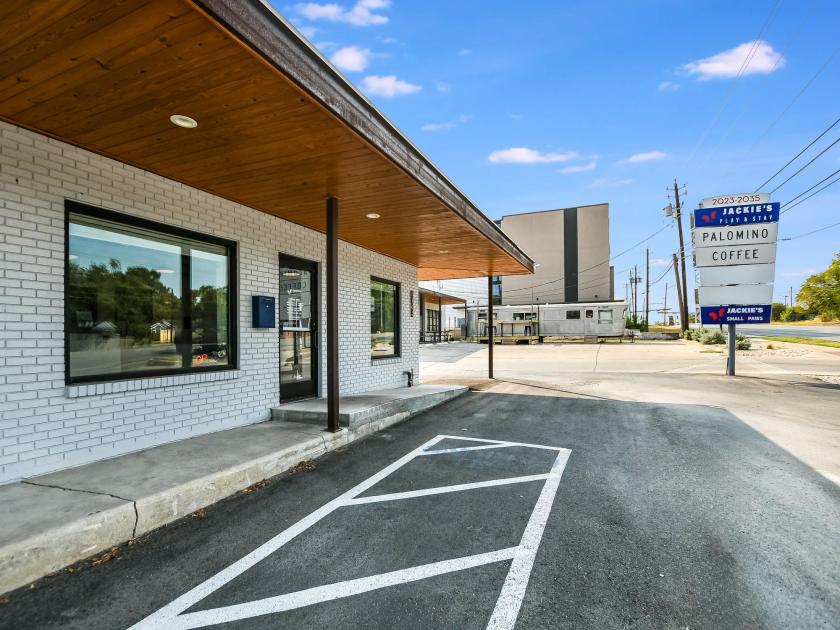
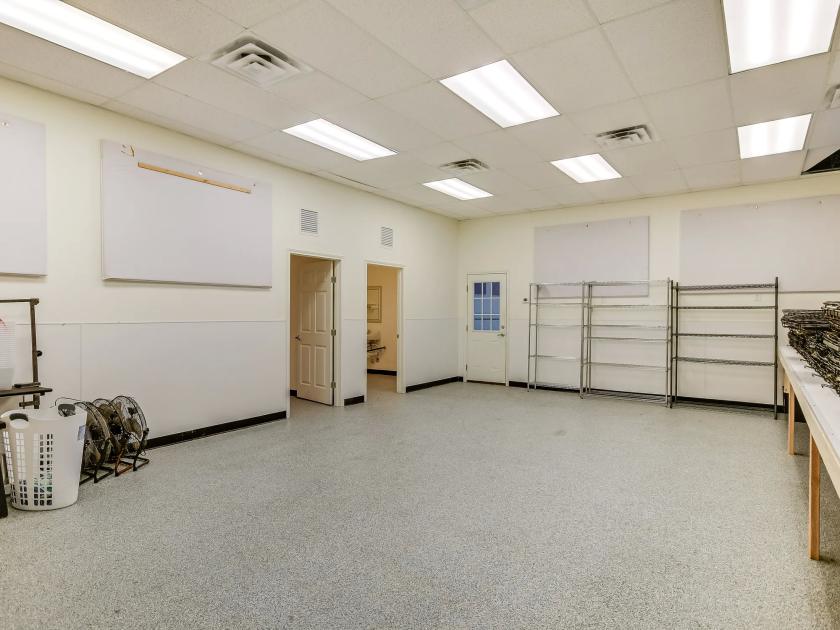
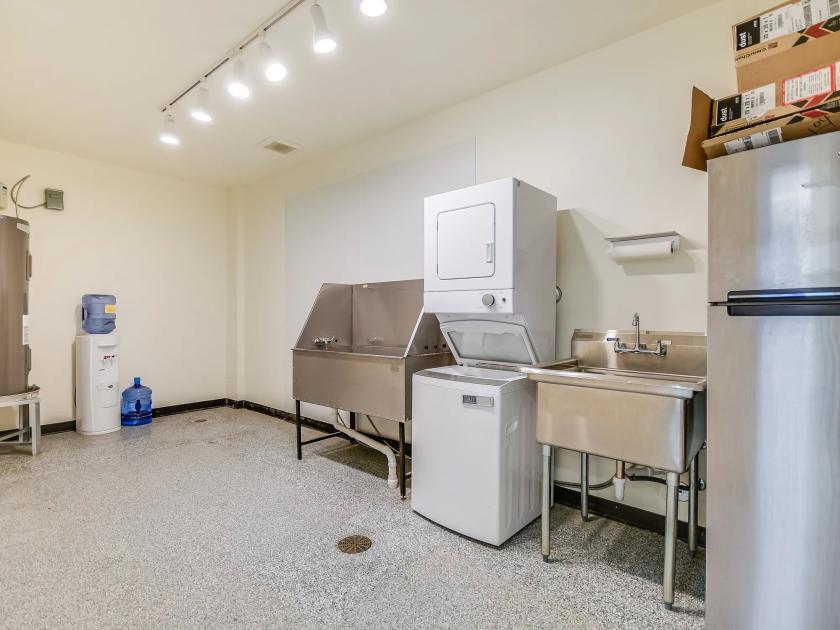
- • Eastside Pet Center
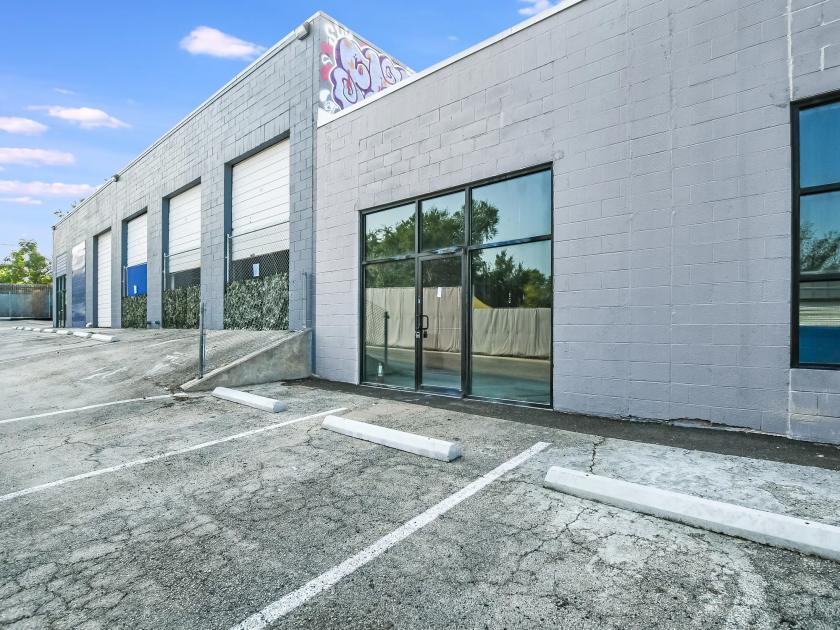
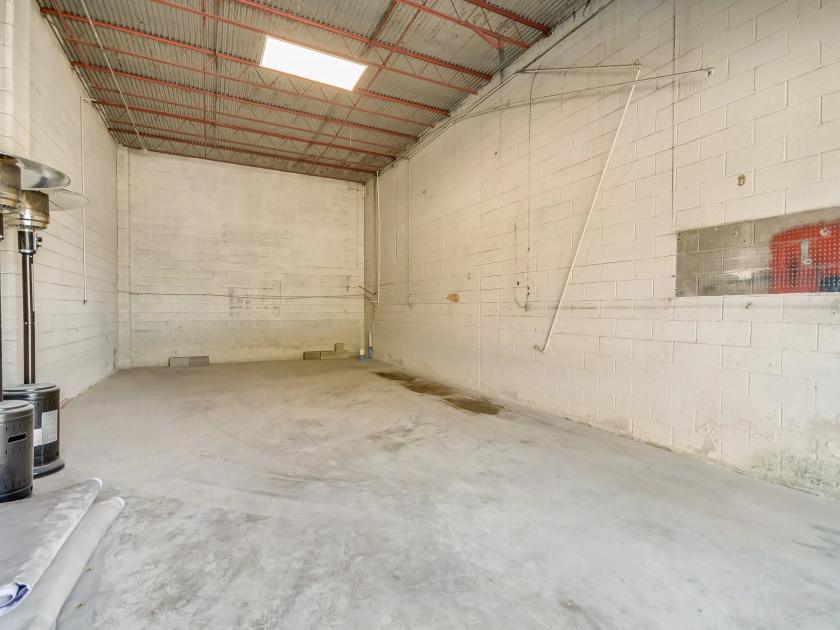
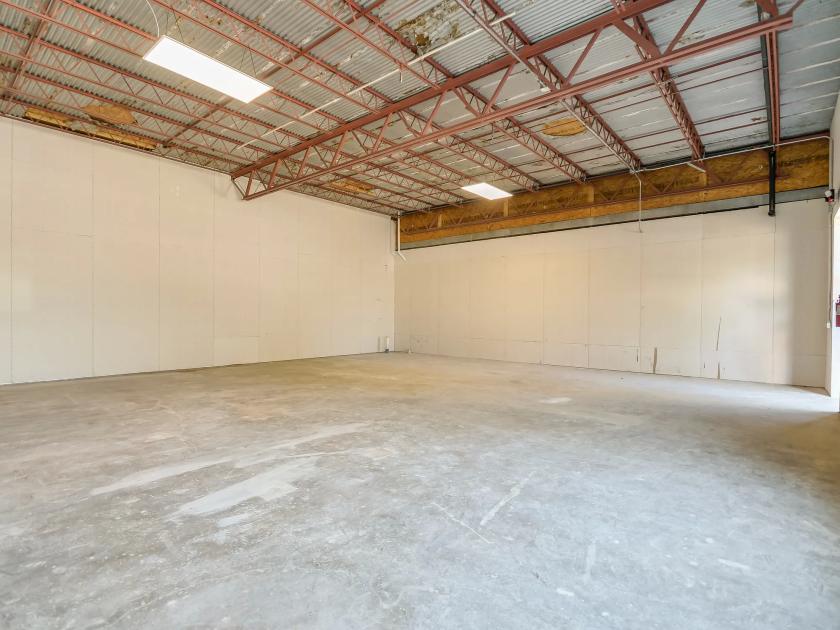
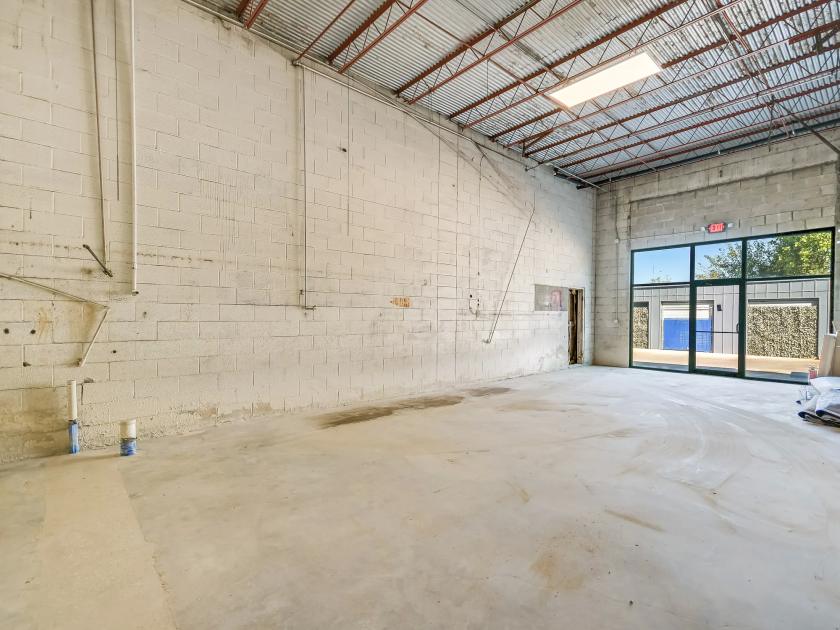
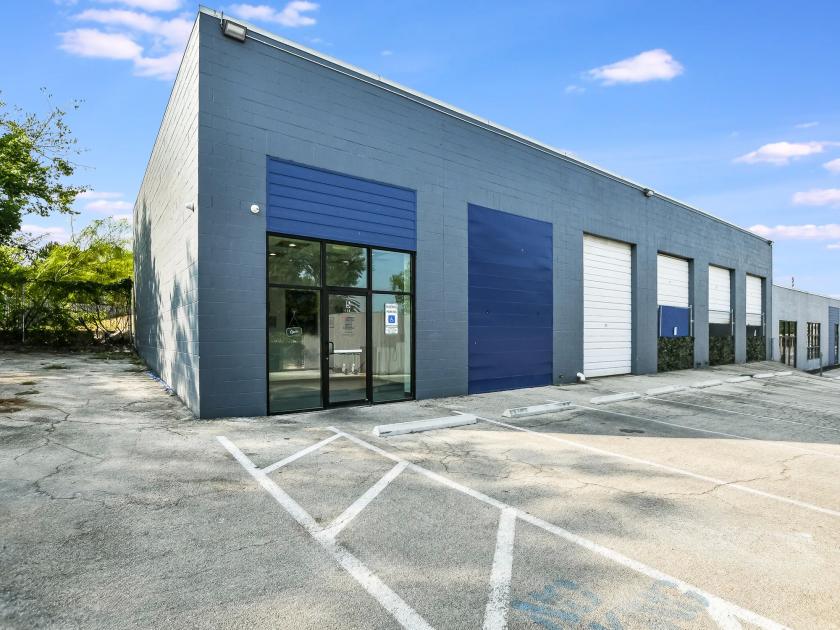
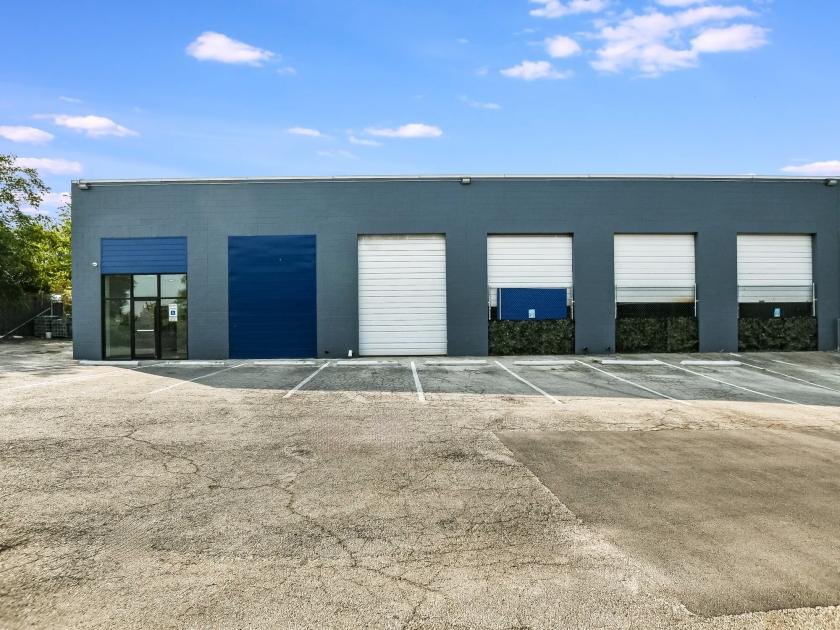
- • High Ceilings, roll up doors
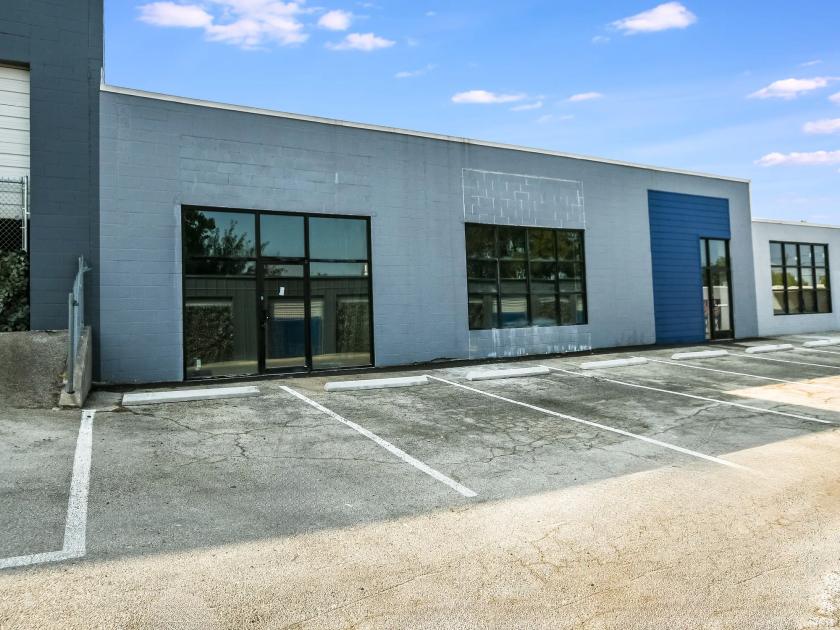
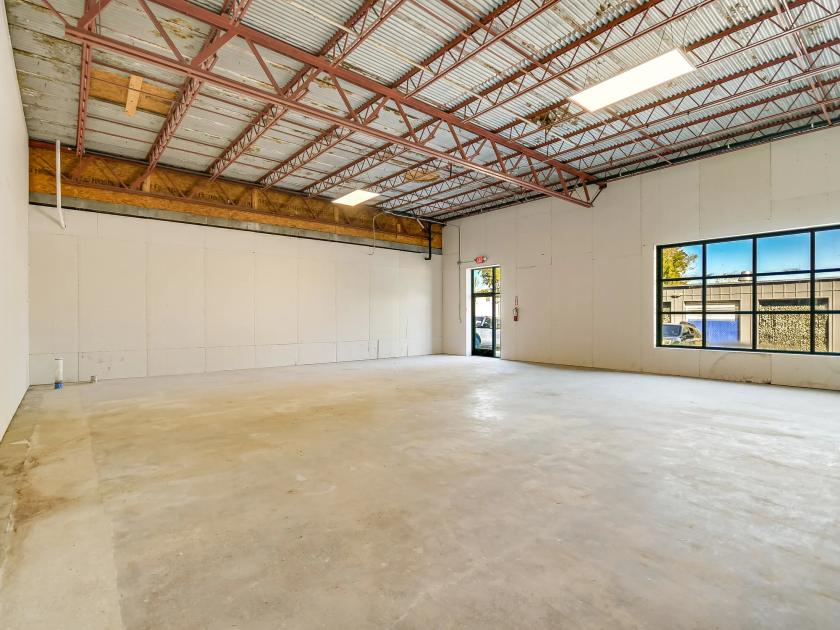
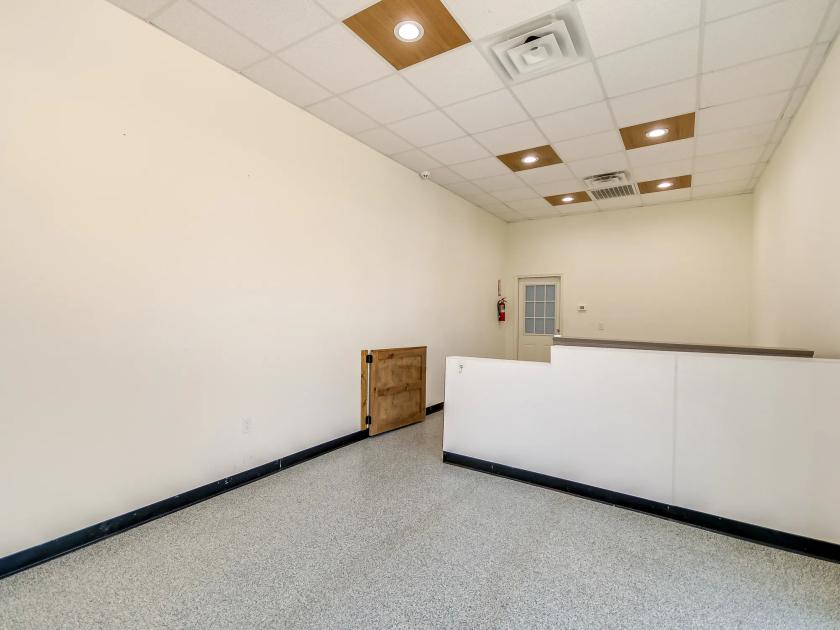
- • Open Floor Plans
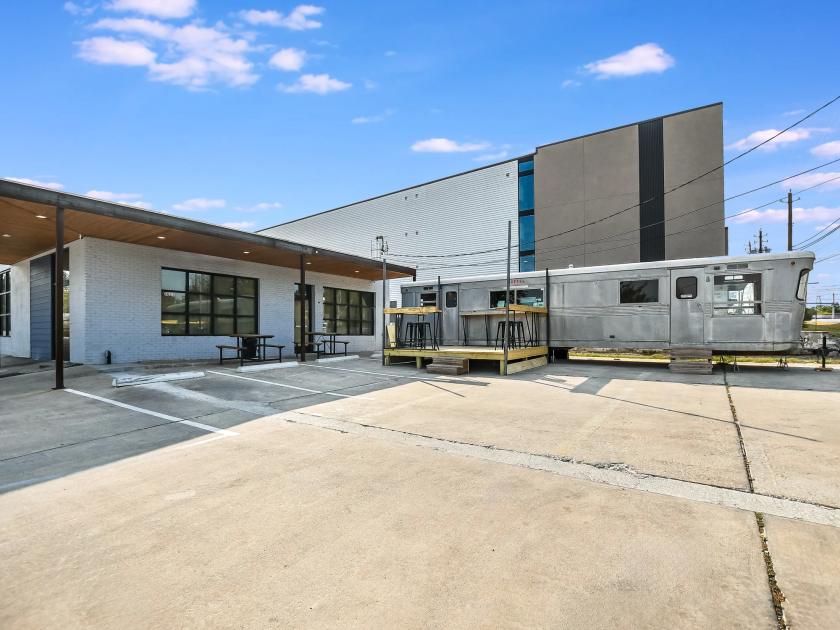
- • Natural Light
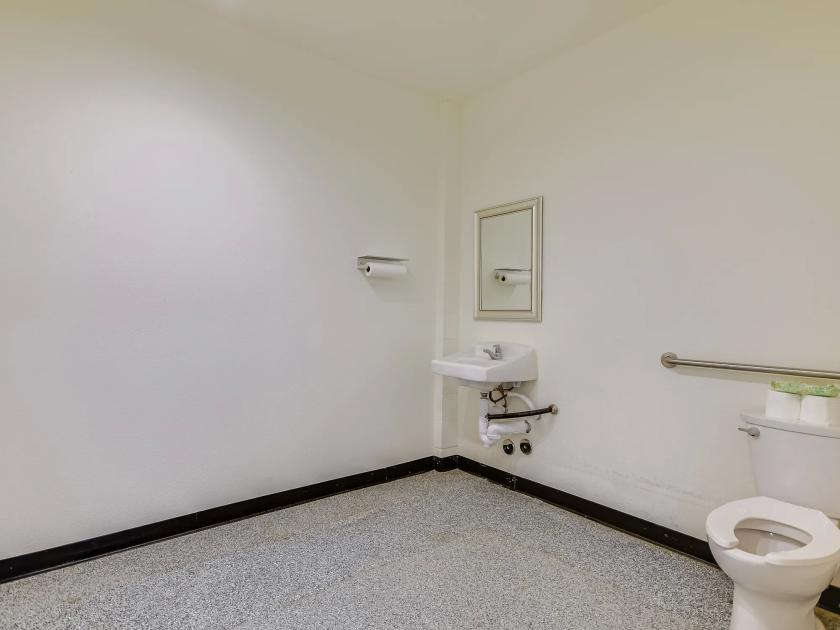
Additional Photos
Listing Agents

Christopher Holcomb
O: 512-467-2222
M: 512-507-5799
christopher@leadcommercial.com
O: 512-467-2222
M: 512-507-5799
christopher@leadcommercial.com

Tim Mooney
O: 512-467-2222
M: 512-658-4916
tim@leadcommercial.com
O: 512-467-2222
M: 512-658-4916
tim@leadcommercial.com
While we strive to provide the most accurate information, all listing information, and demographic data, is provided by third-parties. As such, MyEListing will not be responsible for the accuracy of the information. It is strongly recommended that you verify all information with the listing agent, and any relevant agencies, prior to making any decisions.