Commercial Land
4501 East 57th Street Harrisburg, SD 57032
4501 East 57th Street Harrisburg, SD 57032
Details & Description
Property Highlights
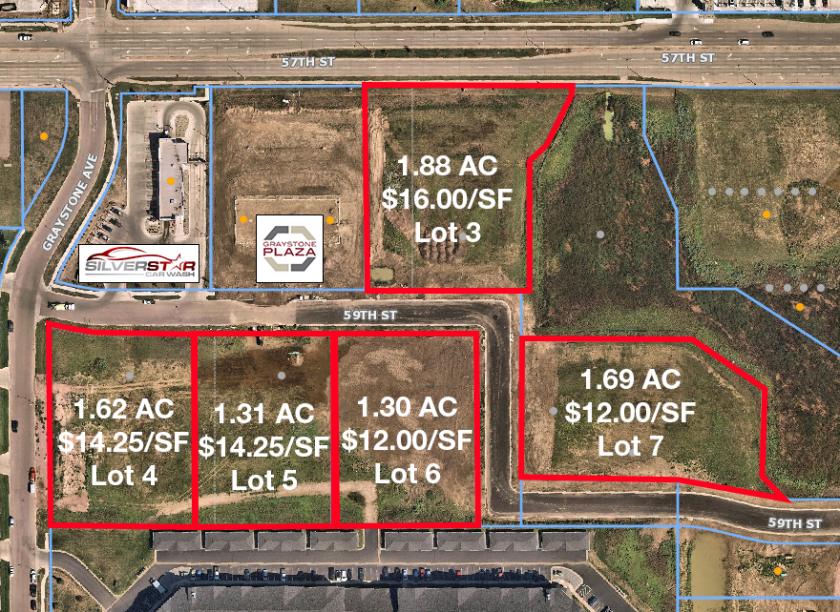
• Planned signalized intersection at 57th Street and Graystone Avenue
• Parcels can be subdivided
Listing Agents

Craig Hagen
O: 605-357-7100
M: 605-310-4227
chagen@naisiouxfalls.com
O: 605-357-7100
M: 605-310-4227
chagen@naisiouxfalls.com
While we strive to provide the most accurate information, all listing information, and demographic data, is provided by third-parties. As such, MyEListing will not be responsible for the accuracy of the information. It is strongly recommended that you verify all information with the listing agent, and any relevant agencies, prior to making any decisions.


