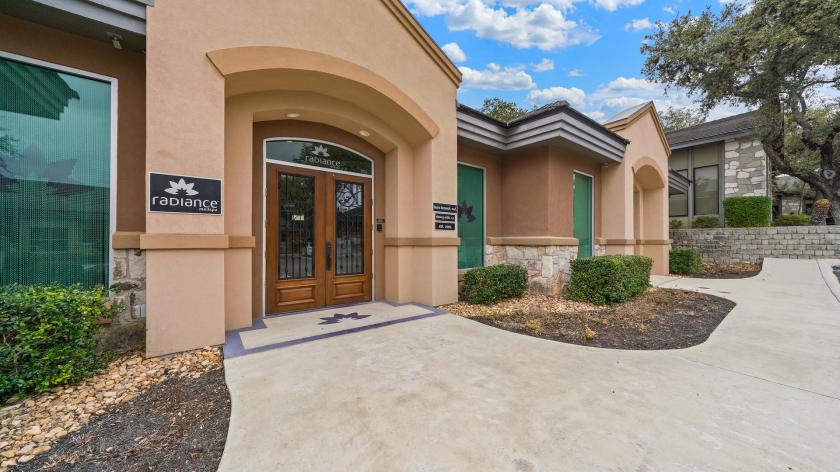
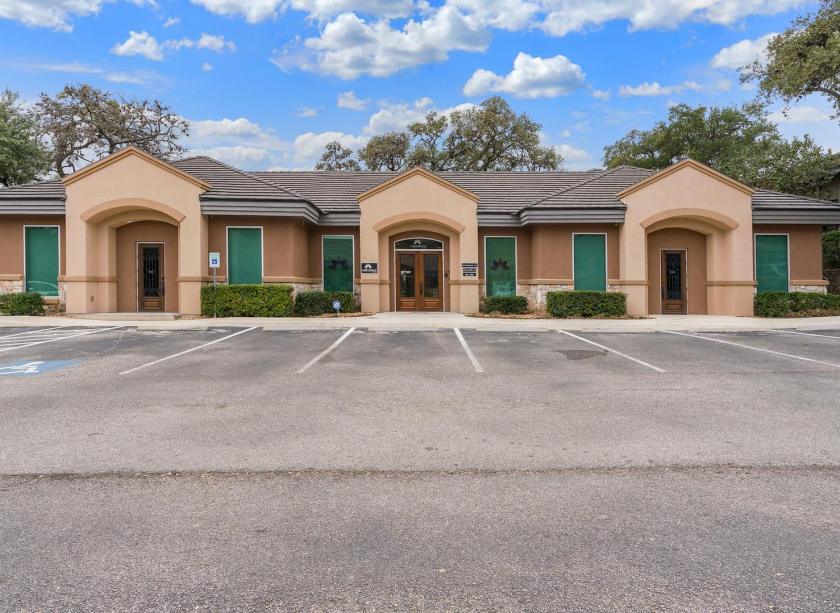
Office Space
1622 Lockhill Selma Road Castle Hills, TX 78213
1622 Lockhill Selma Road Castle Hills, TX 78213
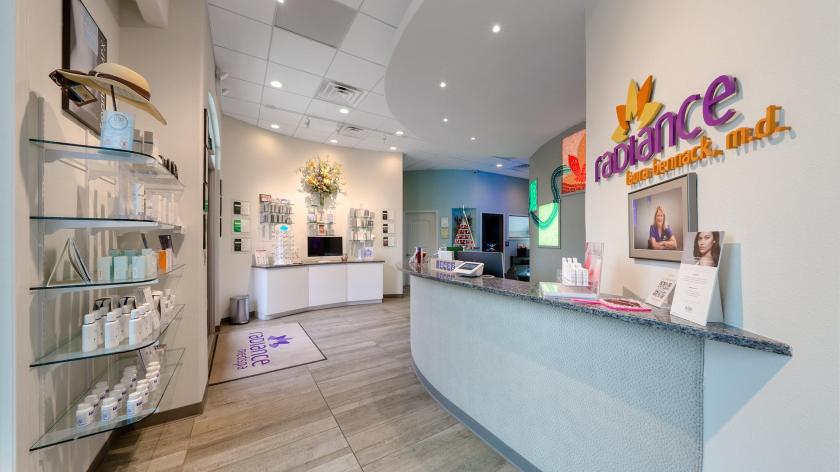
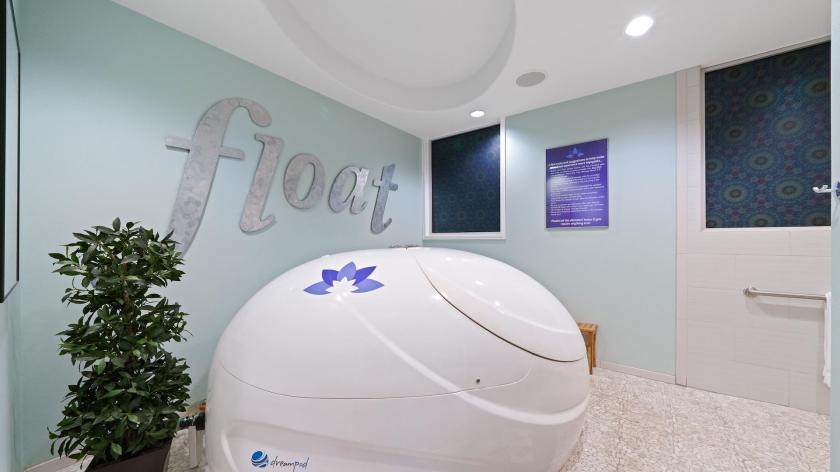
Details & Description
Property Highlights
• No Material Revenue Decrease During COVID Pandemic (2020)
• Proven Recession-Proof Business
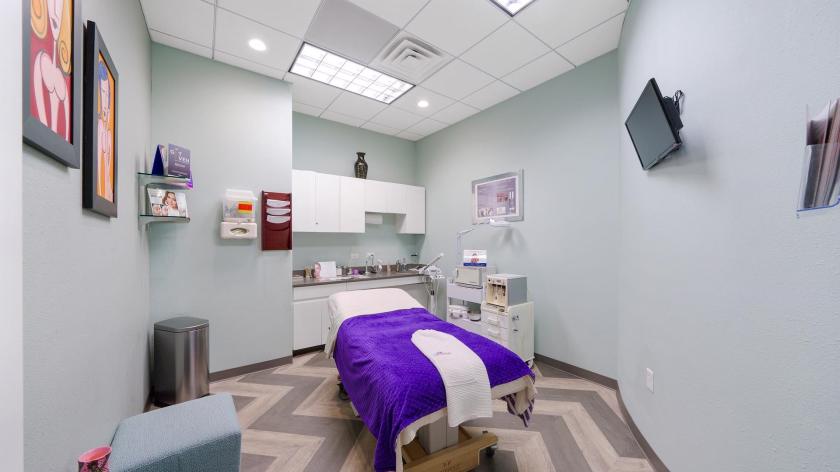
Additional Photos

Listing Agents

James Stewart
O: 210-514-4342
M: 210-514-4342
james.stewart@marcusmillichap.com
O: 210-514-4342
M: 210-514-4342
james.stewart@marcusmillichap.com
While we strive to provide the most accurate information, all listing information, and demographic data, is provided by third-parties. As such, MyEListing will not be responsible for the accuracy of the information. It is strongly recommended that you verify all information with the listing agent, and any relevant agencies, prior to making any decisions.