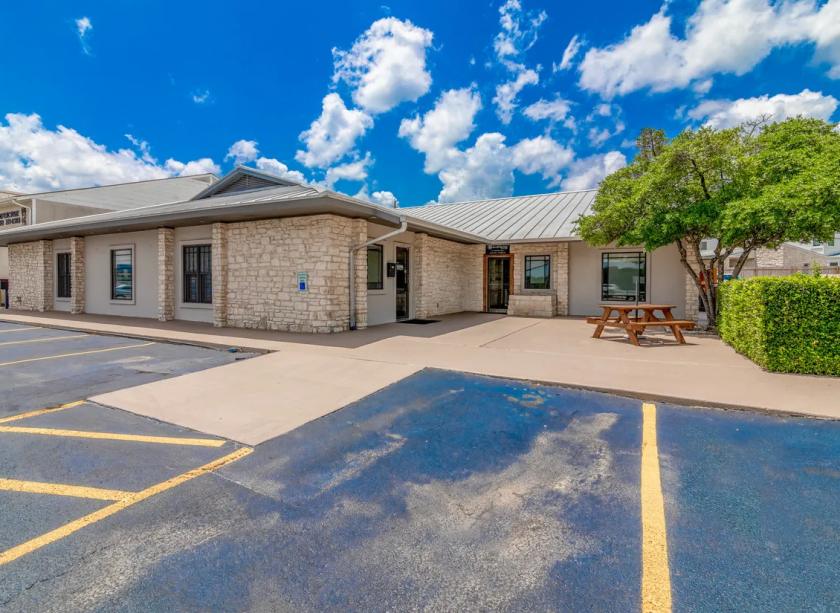
1-Mile | 3-Miles | 5-Miles | ||
---|---|---|---|---|
Total Population | 15,873 | 94,812 | 204,385 | |
Population Median Age | 37 | 37 | 37 | |
Population by Age | 0-9 Yrs | 1879 (11%) | 11077 (11%) | 24295 (11%) |
10-19 Yrs | 1681 (10%) | 10671 (11%) | 23181 (11%) | |
20-29 Yrs | 2140 (13%) | 13014 (13%) | 29656 (14%) | |
30-39 Yrs | 3183 (20%) | 17921 (18%) | 38226 (18%) | |
40-49 Yrs | 2387 (15%) | 15446 (16%) | 32169 (15%) | |
50-59 Yrs | 2467 (15%) | 11933 (12%) | 25408 (12%) | |
60-69 Yrs | 1227 (7%) | 8020 (8%) | 16967 (8%) | |
70+ Yrs | 909 (5%) | 6730 (7%) | 14483 (7%) | |
Median HH Income | $74,301 | $88,928 | $91,702 | |
Total Household Income | < 24K | 432 (6%) | 3380 (8%) | 7578 (8%) |
25-49K | 1224 (18%) | 6391 (16%) | 12728 (15%) | |
50-74K | 1644 (25%) | 7097 (18%) | 15117 (17%) | |
75-99K | 707 (10%) | 4414 (11%) | 10391 (12%) | |
100-199K | 1753 (26%) | 11979 (30%) | 27033 (31%) | |
200K+ | 746 (11%) | 5394 (13%) | 11884 (14%) | |
Highest Education Level | No Diploma | 423 | 2682 | 4567 |
Diploma or GED | 1420 | 7896 | 15614 | |
Some College | 2724 | 12962 | 26067 | |
Assoc. Degree | 605 | 4210 | 9432 | |
Bachelors Degree | 4069 | 24684 | 55667 | |
Higher Degree | 2467 | 16769 | 35371 | |
Total Housing Units | 7,536 | 41,574 | 91,000 | |
--Owner-Occupied | 2,862 | 18,621 | 41,050 | |
--Renter-Occupied | 3,645 | 20,034 | 43,680 | |
Owner-Occupied Values | < 100K | 36 | 274 | 509 |
100-199K | 239 | 1134 | 2475 | |
200-299K | 586 | 4104 | 9014 | |
300-399K | 781 | 4506 | 10711 | |
400-499K | 557 | 3515 | 7775 | |
500K+ | 662 | 5087 | 10565 | |
Total Working Age Population | 12,971 | 77,007 | 164,664 | |
In Work Force | 9,410 | 57,383 | 122,647 | |
Not In Work Force | 3,561 | 19,624 | 42,016 | |
Workforce Employed | 9,062 | 54,535 | 117,179 | |
Workforce Unemployed | 348 | 2,847 | 5,401 | |
Civlian Workforce | 9,410 | 57,383 | 122,579 | |
Military Workforce | 0 | 0 | 68 | |
Total Households | 6,507 | 38,655 | 84,730 | |
Family Households | 3,854 | 23,120 | 48,888 | |
Non-Family Households | 2,653 | 15,535 | 35,842 | |
Married Couple | 3,042 | 18,590 | 39,882 | |
Other Family | 812 | 4,529 | 9,006 | |
Married w/Child | 1,345 | 8,992 | 19,825 | |
Single Male w/Child | 77 | 572 | 1,400 | |
Single Female w/Child | 319 | 1,366 | 3,147 |
Population Change Last Two Decades - Plus Projection
2000 | % | 2010 | % | 2020 | % | 2030 | |
---|---|---|---|---|---|---|---|
Texas | 20,851,820 | +21 | 25,145,561 | +18 | 29,677,668 | +18 | 34,894,452 |
Travis County | 812,280 | +26 | 1,024,266 | +26 | 1,291,502 | +19 | 1,540,812 |
Williamson County | 249,967 | +69 | 422,679 | +40 | 589,914 | +41 | 830,421 |
Total Working Age Population:
Total Households:
Total Working Age Population:
Total Households:
Total Working Age Population:
Total Households: