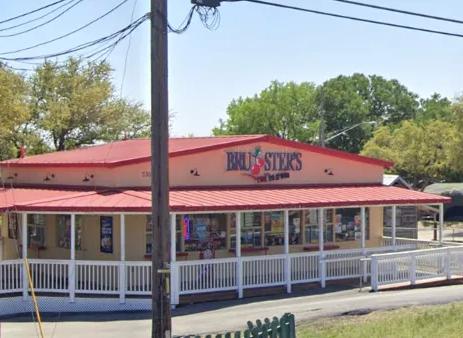
1-Mile | 3-Miles | 5-Miles | ||
---|---|---|---|---|
Total Population | 2,119 | 20,932 | 51,204 | |
Population Median Age | 41 | 39 | 41 | |
Population by Age | 0-9 Yrs | 249 (11%) | 2334 (11%) | 5353 (10%) |
10-19 Yrs | 250 (11%) | 3759 (17%) | 7964 (15%) | |
20-29 Yrs | 165 (7%) | 1462 (6%) | 3470 (6%) | |
30-39 Yrs | 160 (7%) | 2136 (10%) | 5287 (10%) | |
40-49 Yrs | 415 (19%) | 3747 (17%) | 8954 (17%) | |
50-59 Yrs | 400 (18%) | 3482 (16%) | 8489 (16%) | |
60-69 Yrs | 300 (14%) | 2349 (11%) | 6347 (12%) | |
70+ Yrs | 178 (8%) | 1663 (7%) | 5340 (10%) | |
Median HH Income | $95,354 | $139,352 | $129,165 | |
Total Household Income | < 24K | 107 (12%) | 478 (6%) | 1369 (6%) |
25-49K | 104 (11%) | 652 (8%) | 2307 (11%) | |
50-74K | 135 (15%) | 850 (11%) | 2518 (12%) | |
75-99K | 116 (13%) | 703 (9%) | 1767 (8%) | |
100-199K | 250 (28%) | 2525 (33%) | 6280 (31%) | |
200K+ | 169 (19%) | 2440 (31%) | 5881 (29%) | |
Highest Education Level | No Diploma | 123 | 509 | 870 |
Diploma or GED | 276 | 1382 | 3233 | |
Some College | 327 | 2264 | 6696 | |
Assoc. Degree | 37 | 592 | 1808 | |
Bachelors Degree | 604 | 5824 | 15128 | |
Higher Degree | 234 | 3543 | 8218 | |
Total Housing Units | 1,047 | 8,414 | 22,281 | |
--Owner-Occupied | 736 | 6,392 | 15,634 | |
--Renter-Occupied | 146 | 1,256 | 4,488 | |
Owner-Occupied Values | < 100K | 8 | 78 | 190 |
100-199K | 118 | 378 | 742 | |
200-299K | 89 | 484 | 1412 | |
300-399K | 144 | 1297 | 2746 | |
400-499K | 105 | 1502 | 3491 | |
500K+ | 272 | 2653 | 7054 | |
Total Working Age Population | 1,729 | 16,143 | 40,529 | |
In Work Force | 1,173 | 10,762 | 26,662 | |
Not In Work Force | 555 | 5,381 | 13,867 | |
Workforce Employed | 1,065 | 10,247 | 25,304 | |
Workforce Unemployed | 108 | 514 | 1,291 | |
Civlian Workforce | 1,173 | 10,762 | 26,595 | |
Military Workforce | 0 | 0 | 67 | |
Total Households | 882 | 7,648 | 20,122 | |
Family Households | 518 | 5,845 | 14,283 | |
Non-Family Households | 363 | 1,803 | 5,840 | |
Married Couple | 410 | 5,166 | 12,725 | |
Other Family | 108 | 679 | 1,558 | |
Married w/Child | 170 | 2,544 | 5,898 | |
Single Male w/Child | 2 | 155 | 332 | |
Single Female w/Child | 61 | 258 | 642 |
Population Change Last Two Decades - Plus Projection
2000 | % | 2010 | % | 2020 | % | 2030 | |
---|---|---|---|---|---|---|---|
Texas | 20,851,820 | +21 | 25,145,561 | +18 | 29,677,668 | +18 | 34,894,452 |
Travis County | 812,280 | +26 | 1,024,266 | +26 | 1,291,502 | +19 | 1,540,812 |
Total Working Age Population:
Total Households:
Total Working Age Population:
Total Households:
Total Working Age Population:
Total Households: