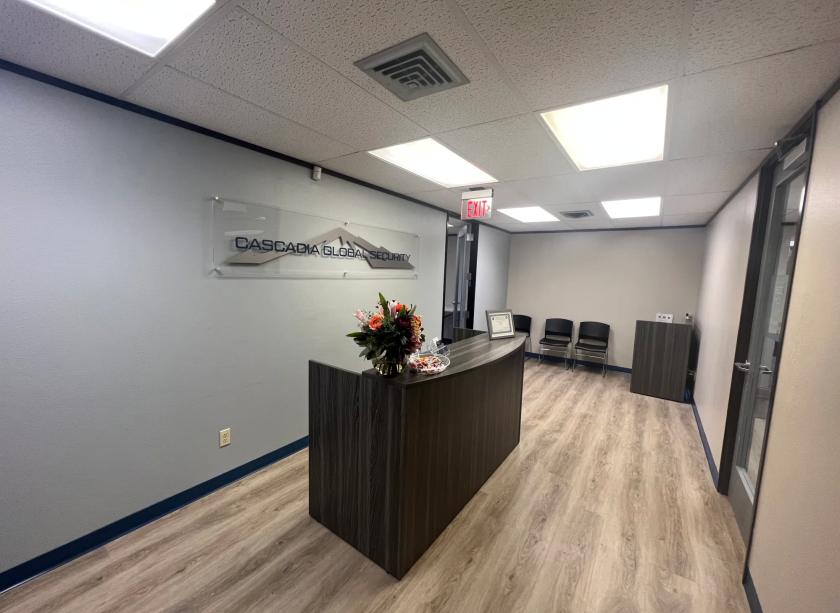
Office Space
3301 Northland Drive Austin, TX 78731
3301 Northland Drive Austin, TX 78731
Details & Description
Property Highlights
- • Convenient location off MoPac
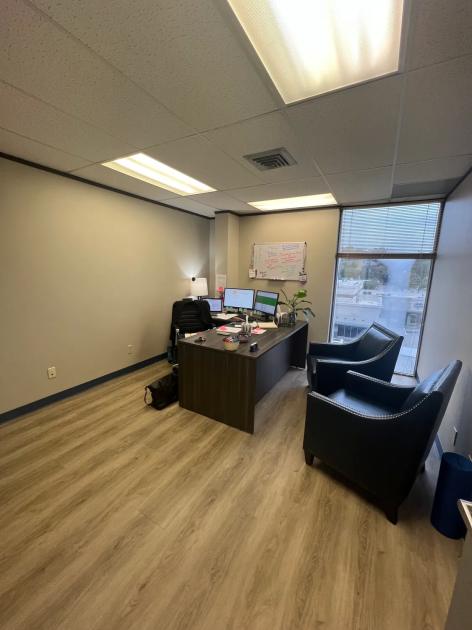
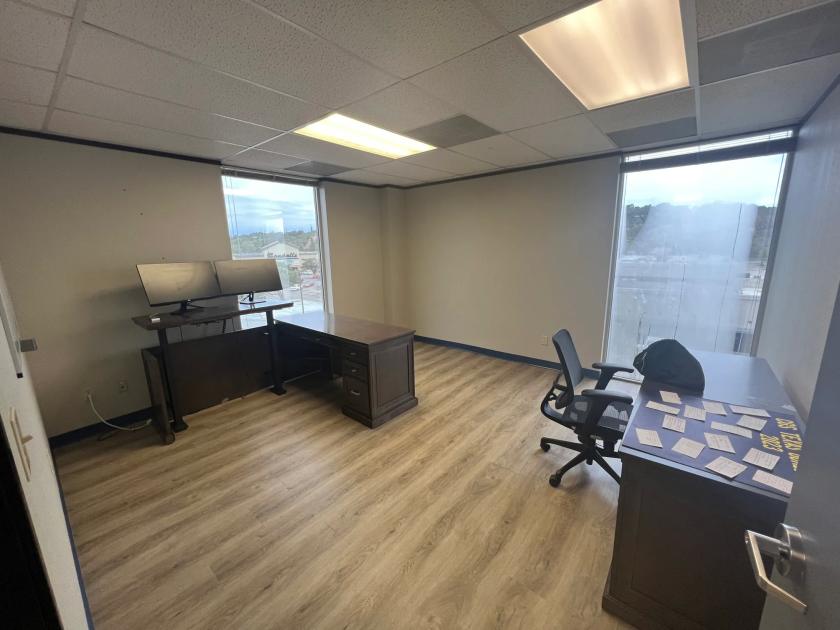
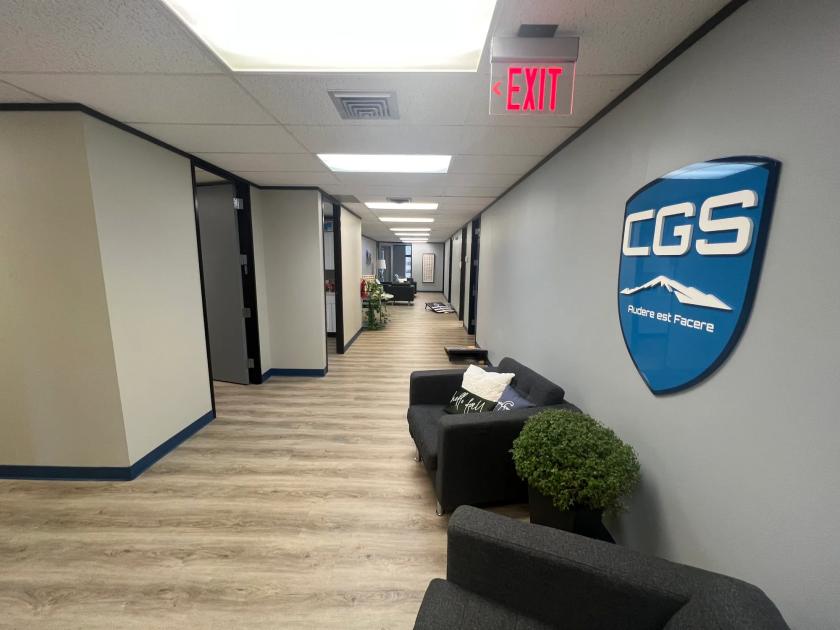
- • 7 private offices
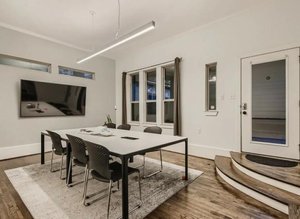
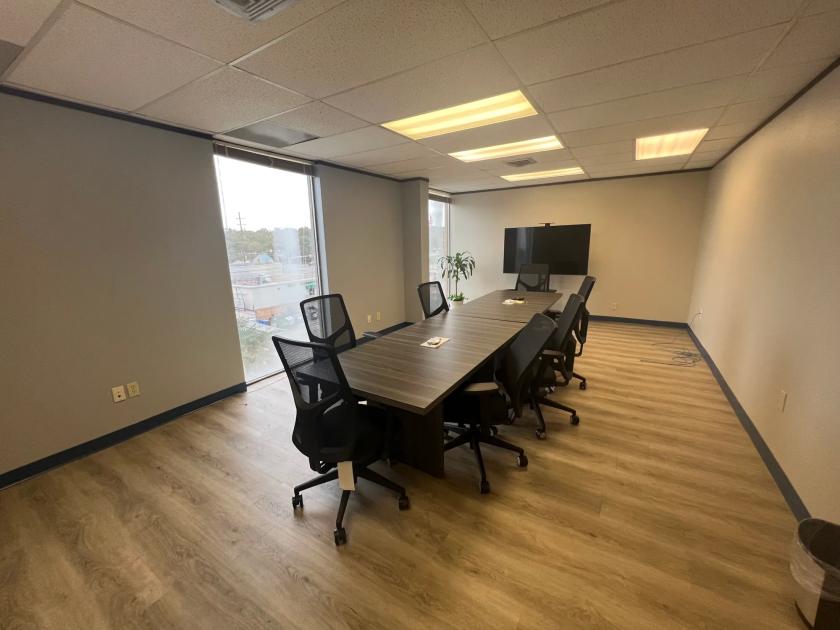
- • 1-2 conference rooms
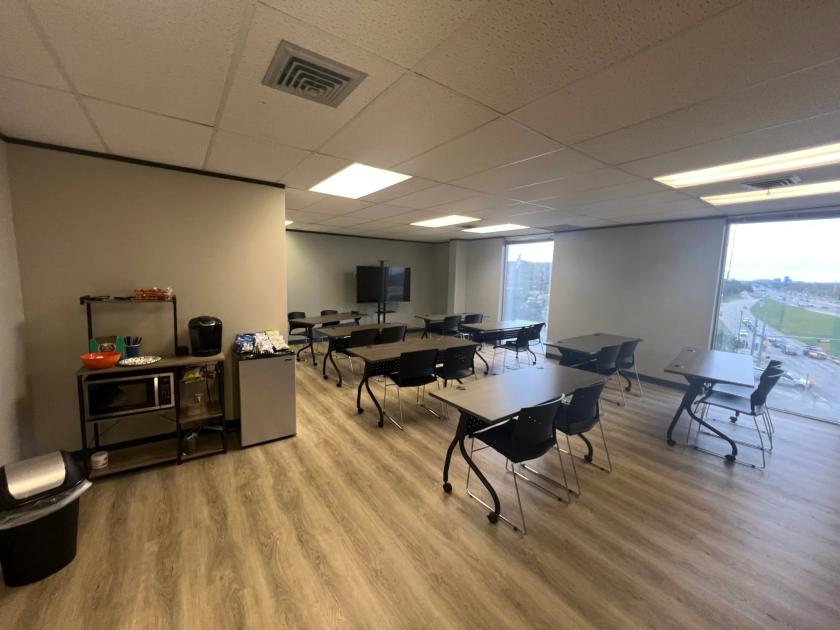
- • Training room
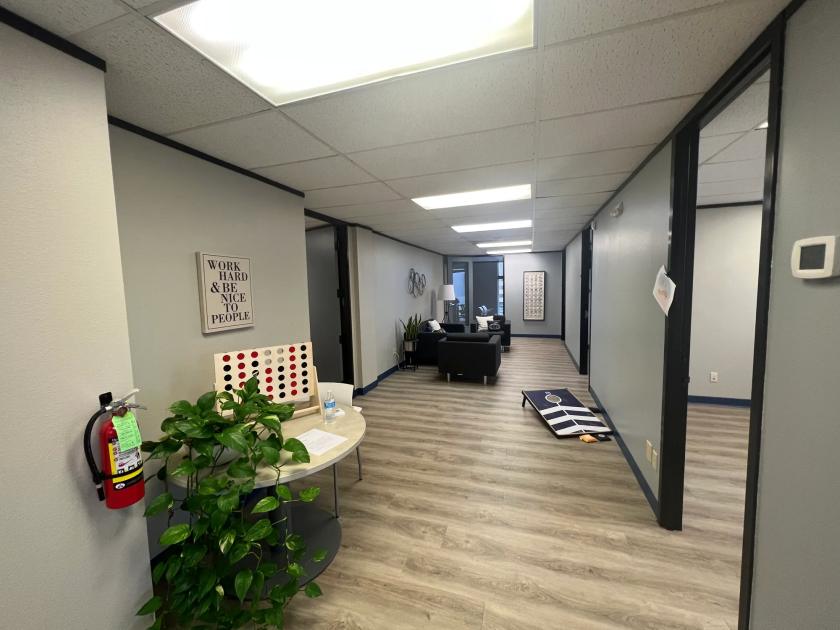
- • Reception area
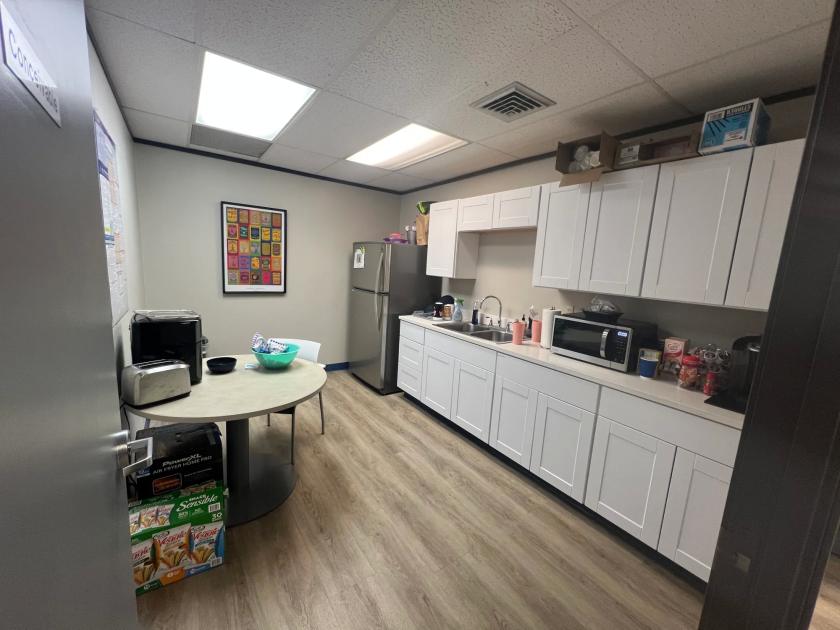
- • Break room
Additional Photos
Listing Agents

Jeremy Avera
O: 512-447-2222
M: 512-574-4402
jeremy@csarealtygroup.com
O: 512-447-2222
M: 512-574-4402
jeremy@csarealtygroup.com

Andrew Creixell
O: 512-447-2222
andrew@csarealtygroup.com
O: 512-447-2222
andrew@csarealtygroup.com
While we strive to provide the most accurate information, all listing information, and demographic data, is provided by third-parties. As such, MyEListing will not be responsible for the accuracy of the information. It is strongly recommended that you verify all information with the listing agent, and any relevant agencies, prior to making any decisions.